The best Asia ETFs
How do I invest in Asian stocks?
The easiest way to invest in the whole Asian stock market is to invest in a broad market index. This can be done at a low cost by using ETFs.
In this curated investment guide, you will find all ETFs that allow you to invest broadly diversified in Asian stocks. Currently, there are 18 ETFs available.
El ratio de gastos totales (TER) de los ETFs de Asia se sitúan entre el 0,10% p.a. y el 0,74% p.a..
0,10% p.a. - 0,74% p.a.
Ratio de gastos totales (TER) anuales de ETFs de Asia
de valores Asian , que son seguidos por ETFs
que siguen un índice ampliamente diversificado de valores Asian
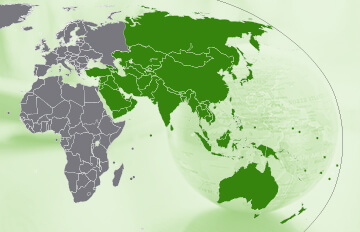
How do I invest in companies from Asia and the Pacific region?
Investing in the Asian stock market can be very easy and cost-effective by using a single ETF that tracks a broadly diversified index that is weighted by market capitalisation.The available Asia ETFs differ significantly in some cases. The Japanese stock market has been highly developed for decades and plays a leading role worldwide. As a consequence, there are a lot of Japan ETFs available. Covering Japan with one of these ETFs, for example on the MSCI Japan or the Nikkei 225, can therefore be done very easily and at low cost. Index providers take this into account, which is why Japan is excluded from most indices covering Asian markets. Moreover, the available ETFs differ in whether only developed markets, only emerging markets or both types are tracked. Furthermore, some indices cover the Pacific region in addition to Asia.
This curated investment guide allows you to compare both the available ETFs and the underlying indices on Asia and the Pacific region and to select an ETF that fits your preferences best.
In our ETF screener, you will find additional Asia ETFs, like sustainable Asia-Pacific ETFs and dividend ETFs on Asia. Furthermore, you can monitor the performance of various Asia and Pacific indices with our market overview “ETF Asia-Pacific”.
Comparación de la rentabilidad de los índices Asian ampliamente diversificados
Fuente: justETF.com; A partir de 22/11/24; Rentabilidad a 1 año en euros.
Índices comparativos
Índices de valores Asian
Los mejores índices sobre los ETFs Asian
Para invertir en valores Asian , existen 6 índices disponibles que son seguidos por 18 ETFs. El ratio de gastos totales (TER) de los ETFs sobre estos índices está entre el 0,10% p.a. y el 0,74% p.a.. Dependiendo del entorno del mercado, las acciones de un solo país pueden constituir grandes partes de un índice. Encontrarás más información sobre la concentración de países, empresas y sectores en las fichas de los índices que figuran a continuación.Índice | Enfoque de inversión | Número de ETF | Número de componentes | Descripción breve |
---|---|---|---|---|
FTSE Developed Asia Pacific ex Japan | Asia Pacífico | 2 ETFs | 399 (31/8/23) | The FTSE Developed Asia Pacific ex Japan index tracks large and mid cap stocks from developed countries in the Asia Pacific region excluding Japan. Ficha del índice |
MSCI AC Asia ex Japan | Asia Pacífico | 1 ETF | 1.070 (30/9/24) | The MSCI AC Asia ex Japan index tracks equity markets of the emerging and developed countries of the Asia region, excluding Japan. Ficha del índice |
MSCI AC Far East ex Japan | Asia Pacífico | 4 ETFs | 919 (30/9/24) | The MSCI AC Far East ex Japan index tracks equity markets of the emerging and developed countries of the East Asian region, excluding Japan. Ficha del índice |
MSCI Emerging Markets Asia | Asia Pacífico | 4 ETFs | 1.027 (30/9/24) | El índice MSCI Emerging Markets Asia analiza empresas de mediana y gran capitalización de los mercados emergentes asiáticos. Ficha del índice |
MSCI Pacific ex Japan | Asia Pacífico | 6 ETFs | 105 (30/9/24) | The MSCI Pacific index tracks the equity markets of the developed markets in the Pacific region excluding Japan (Australia, Hong Kong, Singapore and New Zealand). Ficha del índice |
Solactive Core Developed Markets Pacific ex Japan Large & Mid Cap | Asia Pacífico | 1 ETF | 152 (31/8/23) | The Solactive Core Developed Markets Pacific ex Japan Large & Mid Cap index tracks large and mid cap stocks from developed countries in the Asia Pacific region (excluding Japan). The index excludes companies that are engaged in pure coal mining, controversial weapons or, for a continuous period of three years, have violated the UN Global Compact principles. Ficha del índice |
Índice | 1 mes en % | 3 meses en % | 6 meses en % | 1 año en % | 3 años en % | 5 años en % |
---|---|---|---|---|---|---|
FTSE Developed Asia Pacific ex Japan | -4,16% | -1,24% | 2,55% | 16,48% | 2,89% | 25,16% |
Solactive Core Developed Markets Pacific ex Japan Large & Mid Cap | -3,49% | 5,22% | 9,47% | 21,63% | 10,33% | 24,85% |
MSCI Pacific ex Japan | -3,58% | 4,84% | 9,34% | 22,51% | 11,30% | 25,91% |
MSCI AC Far East ex Japan | -0,81% | 8,05% | 11,08% | 23,27% | -4,58% | 15,59% |
MSCI AC Asia ex Japan | -1,85% | 4,92% | 9,80% | 24,76% | 2,08% | 26,76% |
MSCI Emerging Markets Asia | -1,71% | 4,32% | 9,63% | 25,76% | 3,14% | 31,48% |
Fuente: justETF.com; a 31/10/24; cálculos en euros basados en el mayor ETF del índice respectivo.
Comparación de ETF
ETFs sobre acciones Asia
Todos los ETFs Asia en comparación
En la siguiente tabla hemos enumerado los ETFs Asia disponibles actualmente. A través de las pestañas "Características" y "Rendimiento", puedes encontrar información detallada sobre estos ETF y ordenarlos según el criterio que desees. Para más información sobre los distintos criterios a la hora de elegir un ETF, consulta nuestro artículo sobre la selección correcta del ETF.ETF ISIN | Patrimonio en m EUR | Gastos corrientes en % | Fecha de inicio | Uso del beneficio | Domicilio del fondo | Método de replica |
---|---|---|---|---|---|---|
iShares MSCI EM Asia UCITS ETF (Acc)IE00B5L8K969 | 2.940 | 0,20% p.a. | 6/8/10 | Acumulación | Irlanda | Replicación física perfecta |
iShares Core MSCI Pacific ex Japan UCITS ETF (Acc)IE00B52MJY50 | 2.684 | 0,20% p.a. | 12/1/10 | Acumulación | Irlanda | Replicación física perfecta |
Vanguard FTSE Developed Asia Pacific ex Japan UCITS ETF DistributingIE00B9F5YL18 | 1.088 | 0,15% p.a. | 21/5/13 | Distribución | Irlanda | Replicación física perfecta |
SPDR MSCI EM Asia UCITS ETFIE00B466KX20 | 835 | 0,55% p.a. | 13/5/11 | Acumulación | Irlanda | Replicación física perfecta |
Amundi MSCI Emerging Markets Asia UCITS ETF EUR (C)LU1681044480 | 821 | 0,20% p.a. | 28/4/11 | Acumulación | Luxemburgo | Swap sin fondos |
iShares MSCI AC Far East ex-Japan UCITS ETFIE00B0M63730 | 709 | 0,74% p.a. | 28/10/05 | Distribución | Irlanda | Replicación física perfecta |
Amundi MSCI Emerging Markets Asia UCITS ETF USDLU1681044563 | 586 | 0,20% p.a. | 11/5/11 | Acumulación | Luxemburgo | Swap sin fondos |
HSBC MSCI Pacific ex Japan UCITS ETF USDIE00B5SG8Z57 | 558 | 0,15% p.a. | 3/9/10 | Distribución | Irlanda | Replicación física perfecta |
L&G Asia Pacific ex Japan Equity UCITS ETFIE00BFXR5W90 | 512 | 0,10% p.a. | 8/10/18 | Acumulación | Irlanda | Replicación física perfecta |
Vanguard FTSE Developed Asia Pacific ex Japan UCITS ETF (USD) AccumulatingIE00BK5BQZ41 | 472 | 0,15% p.a. | 24/9/19 | Acumulación | Irlanda | Replicación física perfecta |
UBS ETF (IE) MSCI AC Asia Ex Japan SF UCITS ETF (USD) A-accIE00B7WK2W23 | 253 | 0,23% p.a. | 20/8/12 | Acumulación | Irlanda | Swap |
iShares MSCI Pacific ex-Japan UCITS ETF (Dist)IE00B4WXJD03 | 195 | 0,60% p.a. | 17/4/09 | Distribución | Irlanda | Replicación física perfecta |
HSBC MSCI AC Far East ex Japan UCITS ETF USDIE00BBQ2W338 | 116 | 0,45% p.a. | 27/9/13 | Acumulación | Irlanda | Optimizada muestreo |
UBS ETF (LU) MSCI Pacific (ex Japan) UCITS ETF (USD) A-disLU0446734526 | 70 | 0,14% p.a. | 2/10/09 | Distribución | Luxemburgo | Replicación física perfecta |
iShares MSCI AC Far East ex-Japan UCITS ETF USD (Acc)IE00BKPX3K41 | 33 | 0,74% p.a. | 1/4/20 | Acumulación | Irlanda | Replicación física perfecta |
Amundi MSCI Pacific Ex Japan UCITS ETF DistLU1220245556 | 17 | 0,12% p.a. | 29/4/15 | Distribución | Luxemburgo | Swap sin fondos |
HSBC MSCI Pacific ex Japan UCITS ETF USD (Acc)IE000SGVQIZ9 | 11 | 0,15% p.a. | 19/7/22 | Acumulación | Irlanda | Replicación física perfecta |
HSBC MSCI AC Far East ex Japan UCITS ETF USD (Dist)IE00022VXYM7 | 11 | 0,45% p.a. | 12/7/22 | Distribución | Irlanda | Optimizada muestreo |
ETF ISIN | 1 mes en % | 3 meses en % | 6 meses en % | 1 año en % | 3 años en % | 5 años en % |
---|---|---|---|---|---|---|
iShares MSCI EM Asia UCITS ETF (Acc)IE00B5L8K969 | -1,71% | 4,32% | 9,63% | 25,76% | 3,14% | 31,48% |
iShares Core MSCI Pacific ex Japan UCITS ETF (Acc)IE00B52MJY50 | -3,58% | 4,84% | 9,34% | 22,51% | 11,30% | 25,91% |
Vanguard FTSE Developed Asia Pacific ex Japan UCITS ETF DistributingIE00B9F5YL18 | -4,16% | -1,24% | 2,55% | 16,48% | 2,89% | 25,16% |
SPDR MSCI EM Asia UCITS ETFIE00B466KX20 | -1,67% | 4,16% | 9,37% | 25,15% | 1,62% | 29,68% |
Amundi MSCI Emerging Markets Asia UCITS ETF EUR (C)LU1681044480 | -1,87% | 4,42% | 9,49% | 25,40% | 2,35% | 31,38% |
iShares MSCI AC Far East ex-Japan UCITS ETFIE00B0M63730 | -0,81% | 8,05% | 11,08% | 23,27% | -4,58% | 15,59% |
Amundi MSCI Emerging Markets Asia UCITS ETF USDLU1681044563 | -1,80% | 4,26% | 9,51% | 25,68% | 2,77% | 31,07% |
HSBC MSCI Pacific ex Japan UCITS ETF USDIE00B5SG8Z57 | -3,64% | 4,77% | 9,38% | 22,66% | 11,49% | 25,80% |
L&G Asia Pacific ex Japan Equity UCITS ETFIE00BFXR5W90 | -3,49% | 5,22% | 9,47% | 21,63% | 10,33% | 24,85% |
Vanguard FTSE Developed Asia Pacific ex Japan UCITS ETF (USD) AccumulatingIE00BK5BQZ41 | -4,16% | -1,28% | 2,55% | 16,52% | 2,84% | 25,14% |
UBS ETF (IE) MSCI AC Asia Ex Japan SF UCITS ETF (USD) A-accIE00B7WK2W23 | -1,85% | 4,92% | 9,80% | 24,76% | 2,08% | 26,76% |
iShares MSCI Pacific ex-Japan UCITS ETF (Dist)IE00B4WXJD03 | -3,64% | 4,74% | 9,09% | 22,05% | 10,06% | 23,51% |
HSBC MSCI AC Far East ex Japan UCITS ETF USDIE00BBQ2W338 | -0,79% | 8,15% | 11,26% | 23,56% | -3,90% | 17,10% |
UBS ETF (LU) MSCI Pacific (ex Japan) UCITS ETF (USD) A-disLU0446734526 | -3,62% | 4,82% | 9,31% | 22,51% | 11,21% | 25,50% |
iShares MSCI AC Far East ex-Japan UCITS ETF USD (Acc)IE00BKPX3K41 | -0,85% | 8,18% | 11,28% | 23,31% | -4,59% | - |
Amundi MSCI Pacific Ex Japan UCITS ETF DistLU1220245556 | -3,59% | 4,87% | 9,42% | 22,75% | 11,45% | 25,81% |
HSBC MSCI Pacific ex Japan UCITS ETF USD (Acc)IE000SGVQIZ9 | -3,61% | 4,76% | 9,35% | 22,60% | - | - |
HSBC MSCI AC Far East ex Japan UCITS ETF USD (Dist)IE00022VXYM7 | -0,78% | 8,17% | 11,26% | 23,31% | - | - |
Fuente: justETF.com; a 31/10/24