Top Silver ETFs/ETCs
The silver price
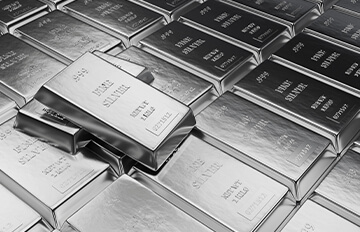
Like with gold, an investment in silver is easily done with listed products like ETFs or ETCs. These investment products track the spot silver price closely, after taking management fees into account. Silver has a significantly lower specific weight and features a lower cost per unit than gold. Therefore, an investment via an ETF or ETC, as opposed to owning the precious metal physically, is even more advantageous for silver.
For investors, however, silver is usually only the second choice. This is because silver is less scarce and used much more for industrial purposes, compared to gold. Therefore, the silver price is a lot more sensitive to economic fluctuations and the associated risk is considerably higher than for gold, at times even higher than for shares.
Besides exchange-traded products on silver in US dollar, there are currency-hedged products available as well. These products are also considered in our comparison. Currently, silver is tracked by 8 ETFs and/or ETCs.

The difference between Silver ETFs and Silver ETCs
The diversification principles of the regulatory investment fund framework (UCITS) do not allow to launch a UCITS fund with only one constituent. Due to this fact, silver is mainly available as an exchange-traded commodity (ETC) in European countries. These products are certificates issued by a financial institution collateralised with physical silver. In contrast to the EU, Swiss regulation allows ETFs for single commodities like silver.
Cost of Silver ETFs/ETCs
The total expense ratio (TER) of Silver ETCs is between 0,19% p.a. and 0,75% p.a.. These costs contain insurance premium, storage costs and additional management fees for the product.
El mejor Silver ETF/ETC por rentabilidad del fondo a un año a partir del 31/3/25
| 1 | Invesco Physical Silver | +36,82% | ||
| 2 | iShares Physical Silver ETC | +36,79% | ||
| 3 | Xtrackers IE Physical Silver ETC Securities | +36,72% |
Todos los Silver ETFs/ETCs clasificados por la rentabilidad del fondo
El mayor Silver ETF/ETC por patrimonio del fondo en euros
| 1 | WisdomTree Physical Silver | 1.785 m | ||
| 2 | iShares Physical Silver ETC | 1.129 m | ||
| 3 | Invesco Physical Silver | 282 m |
Todos los Silver ETFs/ETCs clasificados por patrimonio del fondo
El Silver ETF/ETC más barato por gastos corrientes totales
| 1 | Invesco Physical Silver | 0,19% p.a. | ||
| 2 | WisdomTree Core Physical Silver | 0,19% p.a. | ||
| 3 | iShares Physical Silver ETC | 0,20% p.a. |
Todos los Silver ETFs/ETCs clasificados por gastos corrientes totales
Comparativa de Silver ETFs/ETCs
Además de la rentabilidad, hay otros factores importantes a tener en cuenta a la hora de seleccionar a Silver ETF or ETC. Para proporcionar una base de decisión sólida, encontrarás una lista de todos los Silver ETFs/ETCs con detalles sobre el patrimonio, el coste, la antigüedad, la cobertura de divisas, el tipo de instrumento y la garantía clasificada por patrimonio del fondo.
Compara todos los Silver ETFs/ETCs en detalle
Compara todos los Silver ETFs/ETCs en un gráfico
Fuente: justETF.com; A partir de 17/4/25
Comparación del rendimiento de todos los Silver ETFs/ETCs
La tabla muestra los rendimientos de todos los Silver ETFs/ETCs en comparación. Todas las cifras de rentabilidad incluyen los dividendos a final de mes. Además de la rentabilidad es importante la fecha de referencia en la que se realiza la comparación. Para encontrar el mejor Silver ETF/ETC, también puedes realizar una comparación gráfica.
Fuente: justETF.com; A partir de 31/3/25; Cálculos en EUR, incluidos los dividendos