The best Emerging Markets ETFs
How do I invest in stocks from Emerging Markets?
The easiest way to invest in Emerging Markets worldwide is to invest in a broad market index. This can be done at a low cost by using ETFs.
In this curated investment guide, you will find all ETFs that allow you to invest broadly diversified in Emerging Markets worldwide. Currently, there are 25 ETFs available.
Le ratio des frais totaux (TER) des ETF qui suivent les actions Emerging Markets est compris entre 0,11% p.a. et 0,55% p.a..
0,11% p.a. - 0,55% p.a.
le ratio des dépenses totales annuelles (TER) des ETF Emerging Markets
suivi des actions Emerging Markets suivies par des ETF
suivent un indice Emerging Markets largement diversifié
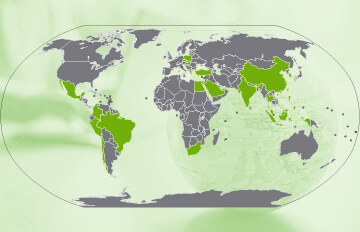
How do I invest in companies from emerging markets?
Investing in emerging markets worldwide can be very easy and cost-effective by using a single ETF that tracks a broadly diversified emerging markets index which is weighted by market capitalisation. Currently, the following indices can be considered for a globally diversified investment in emerging market equities:This curated investment guide allows you to compare both the available ETFs and the underlying indices on emerging markets worldwide and to select an ETF that fits your preferences best. For more information on investing in emerging markets and the indices mentioned above, see our article Emerging Markets ETFs: Investing in Emerging Markets with ETFs.
A worldwide emerging markets ETF is an excellent complement to a global developed markets ETF, like an MSCI World ETF. You can construct a globally diversified, yet simple and cost-efficient portfolio by combining two such ETFs. When using indices from different providers, you should make sure that none of the countries you want to cover is missing or included twice. You can ensure this by selecting two ETFs that track indices from the same provider. For more information on this topic, please have a look at our article MSCI Vs FTSE: Which is the best index provider?.
Alternatively, you may invest in a single World ETF that covers both developed and emerging markets.
In our ETF screener, you will find additional emerging markets ETFs, like sustainable emerging markets ETFs and dividend ETFs on emerging markets. In addition, you can monitor the performance of various emerging market indices with our market overview “ETF Emerging Markets”.
Comparaison des performances des indices Emerging Markets largement diversifiés
Source : Recherche justETF ; Situation au 21/12/2024 ; Performance sur 1 an en EUR.
Les indices en comparaison
Indices sur les actions Emerging Markets
Les meilleurs indices pour les ETF Emerging Markets
Pour un investissement dans des actions Emerging Markets , il existe 3 indices disponibles qui sont suivis par 25 ETF. Le ratio des frais totaux (TER) des ETF sur ces indices est compris entre 0,11% p.a. et 0,55% p.a.. En fonction de l'environnement de marché, les actions d'un seul pays peuvent constituer une part importante d'un indice. Vous trouverez de plus amples informations sur la concentration des pays, des entreprises et des secteurs dans les fiches d'information sur les indices dont les liens figurent ci-dessous.Indice | Objectif d'investissement | Nombre d’ETF | Nombre de composants | Description |
---|---|---|---|---|
FTSE Emerging | Marchés émergents | 3 ETF | 2 219 (28/06/2024) | L'indice FTSE Emerging suit les actions des marchés émergents du monde entier. Fiche d’information |
MSCI Emerging Markets | Marchés émergents | 20 ETF | 1 253 (29/11/2024) | L'indice MSCI Emerging Markets suit les actions des marchés émergents du monde entier. Fiche d’information |
MSCI Emerging Markets Investable Market (IMI) | Marchés émergents | 2 ETF | 3 266 (29/11/2024) | The MSCI Emerging Markets (IMI) index tracks stocks from emerging markets worldwide. Fiche d’information |
Indice | 1 mois en % | 3 mois en % | 6 mois en % | 1 an en % | 3 ans en % | 5 ans en % |
---|---|---|---|---|---|---|
MSCI Emerging Markets Investable Market (IMI) | -1,46% | 3,08% | 5,67% | 15,73% | 5,77% | 26,71% |
MSCI Emerging Markets | -1,90% | 3,19% | 5,69% | 15,77% | 3,15% | 20,72% |
FTSE Emerging | -1,01% | 6,29% | 8,08% | 19,12% | 8,44% | 25,62% |
Source : justETF.com ; Situation au 30/11/2024 ; Calculs en EUR basés sur le plus grand ETF de l'indice en question.
Les ETF en comparaison
ETF qui suivent des actions Emerging Markets
Comparaison de tous les ETF emerging markets
Dans le tableau ci-dessous, nous avons listé les ETF emerging markets actuellement disponibles. Via les onglets "Propriétés" et "Performance", vous pouvez trouver des informations détaillées sur ces ETF et les trier selon le critère que vous souhaitez. Vous trouverez plus d'informations sur les différents critères de choix d'un ETF dans notre article sur la sélection des ETF.ETF ISIN | Taille fonds en M € | Frais en % | Date de création | Utilisation des revenues | Domicile du fonds | Méthode de réplication |
---|---|---|---|---|---|---|
iShares Core MSCI Emerging Markets IMI UCITS ETF (Acc)IE00BKM4GZ66 | 21 472 | 0,18% p.a. | 30/05/2014 | Capitalisation | Irlande | Réplication complète |
Xtrackers MSCI Emerging Markets UCITS ETF 1CIE00BTJRMP35 | 5 488 | 0,18% p.a. | 21/06/2017 | Capitalisation | Irlande | Échantillonnage optimisé |
iShares MSCI EM UCITS ETF (Dist)IE00B0M63177 | 4 504 | 0,18% p.a. | 18/11/2005 | Distribution | Irlande | Réplication complète |
iShares MSCI EM UCITS ETF (Acc)IE00B4L5YC18 | 3 325 | 0,18% p.a. | 25/09/2009 | Capitalisation | Irlande | Réplication complète |
Amundi Index MSCI Emerging Markets UCITS ETF DR (C)LU1437017350 | 3 067 | 0,18% p.a. | 09/05/2017 | Capitalisation | Luxembourg | Réplication complète |
HSBC MSCI Emerging Markets UCITS ETF USDIE00B5SSQT16 | 2 553 | 0,15% p.a. | 05/09/2011 | Distribution | Irlande | Réplication complète |
Amundi MSCI Emerging Markets UCITS ETF EUR (C)LU1681045370 | 2 334 | 0,20% p.a. | 30/11/2010 | Capitalisation | Luxembourg | Swap non financé |
Vanguard FTSE Emerging Markets UCITS ETF DistributingIE00B3VVMM84 | 2 315 | 0,22% p.a. | 22/05/2012 | Distribution | Irlande | Réplication complète |
Amundi MSCI Emerging Markets II UCITS ETF DistLU2573966905 | 2 189 | 0,14% p.a. | 24/03/2023 | Distribution | Luxembourg | Swap non financé |
Amundi MSCI Emerging Markets II UCITS ETF AccLU2573967036 | 1 670 | 0,14% p.a. | 24/03/2023 | Capitalisation | Luxembourg | Swap non financé |
UBS ETF (LU) MSCI Emerging Markets UCITS ETF (USD) A-disLU0480132876 | 1 386 | 0,18% p.a. | 12/11/2010 | Distribution | Luxembourg | Échantillonnage optimisé |
iShares Core MSCI Emerging Markets IMI UCITS ETFIE00BD45KH83 | 1 294 | 0,18% p.a. | 05/03/2018 | Distribution | Irlande | Réplication complète |
Amundi MSCI Emerging Markets UCITS ETF USDLU1681045453 | 874 | 0,20% p.a. | 21/12/2010 | Capitalisation | Luxembourg | Swap non financé |
Amundi MSCI Emerging Markets III UCITS ETF EUR AccFR0010429068 | 807 | 0,55% p.a. | 17/04/2007 | Capitalisation | France | Swap non financé |
SPDR MSCI Emerging Markets UCITS ETFIE00B469F816 | 650 | 0,18% p.a. | 13/05/2011 | Capitalisation | Irlande | Réplication complète |
Vanguard FTSE Emerging Markets UCITS ETF AccIE00BK5BR733 | 615 | 0,22% p.a. | 24/09/2019 | Capitalisation | Irlande | Réplication complète |
Xtrackers MSCI Emerging Markets Swap UCITS ETF 1CLU0292107645 | 584 | 0,49% p.a. | 22/06/2007 | Capitalisation | Luxembourg | Swap non financé |
Amundi Index MSCI Emerging Markets UCITS ETF DR (D)LU1737652583 | 525 | 0,18% p.a. | 05/02/2018 | Distribution | Luxembourg | Réplication complète |
Invesco MSCI Emerging Markets UCITS ETFIE00B3DWVS88 | 386 | 0,19% p.a. | 26/04/2010 | Capitalisation | Irlande | Swap non financé |
HSBC MSCI Emerging Markets UCITS ETF USD (Acc)IE000KCS7J59 | 310 | 0,15% p.a. | 28/06/2022 | Capitalisation | Irlande | Réplication complète |
Xtrackers MSCI Emerging Markets UCITS ETF 1DIE000GWA2J58 | 208 | 0,18% p.a. | 03/11/2021 | Distribution | Irlande | Réplication complète |
Amundi Index MSCI Emerging Markets UCITS ETF DR - USD (D)LU2277591868 | 156 | 0,18% p.a. | 02/02/2021 | Distribution | Luxembourg | Réplication complète |
Amundi MSCI Emerging Markets III UCITS ETF USD AccFR0010435297 | 106 | 0,55% p.a. | 23/04/2007 | Capitalisation | France | Swap non financé |
Xtrackers MSCI Emerging Markets Swap UCITS ETF 1DLU2675291913 | 97 | 0,18% p.a. | 11/10/2023 | Distribution | Luxembourg | Swap non financé |
Franklin FTSE Emerging Markets UCITS ETF USD CapitalisationIE0004I037N4 | 9 | 0,11% p.a. | 22/10/2024 | Capitalisation | Irlande | Réplication complète |
ETF ISIN | 1 mois en % | 3 mois en % | 6 mois en % | 1 an en % | 3 ans en % | 5 ans en % |
---|---|---|---|---|---|---|
iShares Core MSCI Emerging Markets IMI UCITS ETF (Acc)IE00BKM4GZ66 | -1,46% | 3,08% | 5,67% | 15,73% | 5,77% | 26,71% |
Xtrackers MSCI Emerging Markets UCITS ETF 1CIE00BTJRMP35 | -1,90% | 3,19% | 5,69% | 15,77% | 3,15% | 20,72% |
iShares MSCI EM UCITS ETF (Dist)IE00B0M63177 | -1,82% | 3,27% | 5,81% | 15,83% | 3,36% | 21,03% |
iShares MSCI EM UCITS ETF (Acc)IE00B4L5YC18 | -1,83% | 3,29% | 5,83% | 15,93% | 3,55% | 21,32% |
Amundi Index MSCI Emerging Markets UCITS ETF DR (C)LU1437017350 | -1,19% | 3,96% | 6,48% | 16,48% | 3,85% | 21,84% |
HSBC MSCI Emerging Markets UCITS ETF USDIE00B5SSQT16 | -1,84% | 3,40% | 5,55% | 15,10% | 2,68% | 19,63% |
Amundi MSCI Emerging Markets UCITS ETF EUR (C)LU1681045370 | -0,58% | 3,83% | 6,85% | 16,52% | 3,00% | 21,75% |
Vanguard FTSE Emerging Markets UCITS ETF DistributingIE00B3VVMM84 | -1,01% | 6,29% | 8,08% | 19,12% | 8,44% | 25,62% |
Amundi MSCI Emerging Markets II UCITS ETF DistLU2573966905 | -1,07% | 4,03% | 6,63% | 16,80% | - | - |
Amundi MSCI Emerging Markets II UCITS ETF AccLU2573967036 | -1,05% | 4,05% | 6,63% | 16,80% | - | - |
UBS ETF (LU) MSCI Emerging Markets UCITS ETF (USD) A-disLU0480132876 | -1,92% | 3,37% | 5,95% | 15,87% | 3,69% | 20,90% |
iShares Core MSCI Emerging Markets IMI UCITS ETFIE00BD45KH83 | -1,54% | 3,08% | 5,70% | 15,77% | 5,85% | 26,72% |
Amundi MSCI Emerging Markets UCITS ETF USDLU1681045453 | -1,15% | 4,04% | 6,40% | 16,52% | 4,04% | 21,46% |
Amundi MSCI Emerging Markets III UCITS ETF EUR AccFR0010429068 | -0,70% | 3,66% | 6,61% | 16,03% | 2,08% | 20,08% |
SPDR MSCI Emerging Markets UCITS ETFIE00B469F816 | -1,89% | 3,33% | 5,86% | 15,93% | 3,33% | 21,09% |
Vanguard FTSE Emerging Markets UCITS ETF AccIE00BK5BR733 | -1,02% | 6,29% | 8,09% | 19,13% | 8,45% | 25,63% |
Xtrackers MSCI Emerging Markets Swap UCITS ETF 1CLU0292107645 | -1,91% | 3,11% | 5,60% | 15,50% | 2,71% | 19,28% |
Amundi Index MSCI Emerging Markets UCITS ETF DR (D)LU1737652583 | -1,19% | 3,95% | 6,49% | 16,49% | 3,85% | 21,38% |
Invesco MSCI Emerging Markets UCITS ETFIE00B3DWVS88 | -1,90% | 3,08% | 5,56% | 15,45% | 2,67% | 19,60% |
HSBC MSCI Emerging Markets UCITS ETF USD (Acc)IE000KCS7J59 | -1,91% | 3,36% | 5,38% | 15,05% | - | - |
Xtrackers MSCI Emerging Markets UCITS ETF 1DIE000GWA2J58 | -1,93% | 3,13% | 5,64% | 15,81% | 3,03% | - |
Amundi Index MSCI Emerging Markets UCITS ETF DR - USD (D)LU2277591868 | -1,10% | 4,04% | 6,60% | 16,56% | 3,92% | - |
Amundi MSCI Emerging Markets III UCITS ETF USD AccFR0010435297 | -1,16% | 3,83% | 6,34% | 16,24% | 3,07% | 19,62% |
Xtrackers MSCI Emerging Markets Swap UCITS ETF 1DLU2675291913 | -1,84% | 3,22% | 5,70% | 15,91% | - | - |
Franklin FTSE Emerging Markets UCITS ETF USD CapitalisationIE0004I037N4 | -1,13% | - | - | - | - | - |
Source : justETF.com ; situation au : 30/11/2024