Your selection basket is empty.
Define a selection of ETFs which you would like to compare.
Add an ETF by clicking "Compare" on an ETF profile or by checkmarking an ETF in the ETF search.
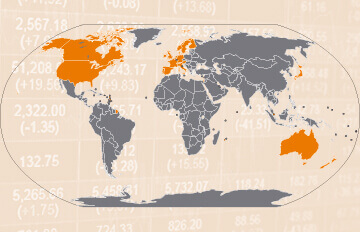
The MSCI World is an international equity index which tracks stocks from 23 developed countries. With 1,310 constituents (as of 30/04/2026), the index covers approximately 85% of the free float-adjusted market capitalization in each country.
Stocks from the USA make up the biggest weight in the MSCI World index with 71.91%, followed by Japan (5.68%) and the UK (3.68%). Top sectors within the MSCI World index are information technology (27.61%), financial services (15.99%) and industrials (11.76%). Source: MSCI; As of 30/04/2026
ETF investors can benefit from price gains and dividends of the MSCI World constituents. Currently, the MSCI World index is tracked by 5 ETFs.
Source: justETF.com; As of 07/05/2026; Performance in EUR, based on the largest ETF.
The total expense ratio (TER) of MSCI World ETFs is between 0.06% p.a. and 0.50% p.a.. In comparison, most actively managed funds do cost much more fees per year. Calculate your individual cost savings by using our cost calculator.
| 1 | UBS Core MSCI World UCITS ETF USD acc | 25.73% | ||
| 2 | UBS Core MSCI World UCITS ETF USD dis | 25.72% | ||
| 3 | Xtrackers MSCI World UCITS ETF 1D | 25.64% |
All MSCI World ETFs ranked by fund return
| 1 | Amundi MSCI World Swap II UCITS ETF Dist | 8,175 m | ||
| 2 | UBS Core MSCI World UCITS ETF USD acc | 8,165 m | ||
| 3 | iShares MSCI World UCITS ETF (Dist) | 7,718 m |
All MSCI World ETFs ranked by fund size
| 1 | UBS Core MSCI World UCITS ETF USD acc | 0.06% p.a. | ||
| 2 | UBS Core MSCI World UCITS ETF USD dis | 0.06% p.a. | ||
| 3 | Xtrackers MSCI World UCITS ETF 1D | 0.12% p.a. |
All MSCI World ETFs ranked by total expense ratio
Besides return, there are further important factors to consider when selecting a MSCI World ETF. In order to provide a sound decision basis, you find a list of all MSCI World ETFs with details on size, cost, age, use of profits, fund domicile and replication method ranked by fund size.
Compare all MSCI World ETFs in detail
Compare all MSCI World ETFs in a chart
| ETF name ISIN | Fund size in m EUR | TER in % | Use of profits | Fund domicile | Replication method | |
|---|---|---|---|---|---|---|
| Amundi MSCI World Swap II UCITS ETF DistFR0010315770 | 8,175 | 0.30% p.a. | Distributing | France | Unfunded swap | |
| UBS Core MSCI World UCITS ETF USD accIE00BD4TXV59 | 8,165 | 0.06% p.a. | Accumulating | Ireland | Full replication | |
| iShares MSCI World UCITS ETF (Dist)IE00B0M62Q58 | 7,718 | 0.50% p.a. | Distributing | Ireland | Optimized sampling | |
| Xtrackers MSCI World UCITS ETF 1DIE00BK1PV551 | 4,385 | 0.12% p.a. | Distributing | Ireland | Optimized sampling | |
| UBS Core MSCI World UCITS ETF USD disIE00B7KQ7B66 | 1,747 | 0.06% p.a. | Distributing | Ireland | Full replication |
Source: justETF.com; As of 07/05/2026
The table shows the returns of all MSCI World ETFs in comparison. All return figures are including dividends as of month end. Besides the return the reference date on which you conduct the comparison is important. In order to find the best ETFs, you can also perform a chart comparison.
| ETF | 1 month in % | 3 months in % | 6 months in % | 1 year in % | 3 years in % | |
|---|---|---|---|---|---|---|
| UBS Core MSCI World UCITS ETF USD acc | 10.03% | 5.32% | 5.74% | 25.73% | 61.60% | |
| UBS Core MSCI World UCITS ETF USD dis | 10.00% | 5.30% | 5.71% | 25.72% | 61.52% | |
| Xtrackers MSCI World UCITS ETF 1D | 10.02% | 5.31% | 5.71% | 25.64% | 61.42% | |
| Amundi MSCI World Swap II UCITS ETF Dist | 9.57% | 4.85% | 5.54% | 25.17% | 61.66% | |
| iShares MSCI World UCITS ETF (Dist) | 9.99% | 5.23% | 5.51% | 25.16% | 59.74% |
| ETF | 2026 in % | 2025 in % | 2024 in % | 2023 in % | 2022 in % | |
|---|---|---|---|---|---|---|
| Xtrackers MSCI World UCITS ETF 1D | 5.41% | 7.18% | 26.31% | 19.70% | -13.01% | |
| UBS Core MSCI World UCITS ETF USD dis | 5.39% | 7.24% | 26.43% | 19.49% | -13.20% | |
| UBS Core MSCI World UCITS ETF USD acc | 5.38% | 7.24% | 26.43% | 19.47% | -13.20% | |
| iShares MSCI World UCITS ETF (Dist) | 5.34% | 6.78% | 25.92% | 19.24% | -13.24% | |
| Amundi MSCI World Swap II UCITS ETF Dist | 5.09% | 6.79% | 26.66% | 19.73% | -12.70% |
Source: justETF.com; As of 30/04/2026; Calculations in EUR including dividends

