The best World ETFs
How to invest globally in stocks?
The easiest way to invest in the global stock market is to invest in a broad market index. This can be done at a low cost by using ETFs.
In this curated investment guide, you will find all ETFs that allow you to invest broadly diversified in stocks worldwide. Currently, there are 11 ETFs available.
The total expense ratio (TER) of ETFs tracking stocks from countries worldwide is between 0,00% p.a. and 0,22% p.a..
0,00% p.a. - 0,22% p.a.
annual total expense ratio (TER) of World ETFs
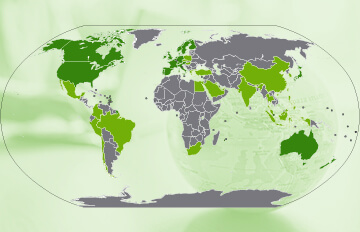
tracking stocks from countries worldwide, which are tracked by ETFs
that track a broadly diversified World index

How do I invest in companies around the world?
Investing in the global equity market can be very easy and cost-effective by using a single ETF that tracks a broadly diversified world index that is weighted by market capitalisation. Such global indices are available for developed markets, emerging markets or both regions combined. If you want to cover developed and emerging markets from all over the world with just one ETF, the following indices can be considered:This investment guide allows you to compare both the available ETFs and the underlying indices on developed and emerging markets worldwide and to select the ETF that fits your preferences best. As an alternative to a single-ETF solution, you may also combine a developed markets ETF and an emerging markets ETF to form a simple portfolio. The result: greater flexibility and even potentially lower costs.
Additional world ETFs which focus on specific equity strategies or investment trends can be easily found in our ETF screener. Furthermore, we provide you with curated investment guides on various topics, such as sustainable world ETFs and global dividend ETFs.
Performance of broadly diversified World indices in comparison
Source: justETF Research; As of 21-04-2025; Performance over 1 year in EUR.
Indices in comparison
Indices on stocks from countries worldwide
The best indices for World ETFs
For an investment in stocks from countries worldwide, there are 4 indices available that are tracked by 11 ETFs. The total expense ratio (TER) of ETFs on these indices is between 0,00% p.a. and 0,22% p.a.. Depending on the market environment, stocks from a single country can make up large parts of an index. You can find more information regarding the concentration of countries, companies and sectors in the index factsheets linked below.| Index | Investment focus | Number of ETFs | Number of constituents | Short description |
|---|---|---|---|---|
| FTSE All-World | Wereld | 4 ETFs | 4.291 (28-06-2024) | The FTSE All-World index tracks stocks from developed and emerging countries worldwide. Index factsheet |
| MSCI All Country World (ACWI) | Wereld | 3 ETFs | 2.558 (31-03-2025) | The MSCI All Country World Index (ACWI) tracks large- and mid-cap stocks from 23 developed and 24 emerging markets worldwide. Index factsheet |
| MSCI All Country World Investable Market (ACWI IMI) | Wereld | 2 ETFs | 8.406 (31-03-2025) | The MSCI All Country World Investable Market Index (ACWI IMI) tracks stocks from 23 developed and 24 emerging markets worldwide. It covers securities across large, mid and small cap size segments. Index factsheet |
| Solactive GBS Global Markets Large & Mid Cap | Wereld | 2 ETFs | 3.497 (28-06-2024) | The Solactive GBS Global Markets Large & Mid Cap index tracks large- and mid-cap stocks from developed and emerging markets worldwide. Index factsheet |
Source: justETF.com; As of 31-03-2025; Calculations in EUR based on the largest ETF of the respective index.
ETFs in comparison
ETFs tracking stocks from countries worldwide
All World ETFs in comparison
In the table below we have listed the currently available World ETFs. Via the "Properties" and "Performance" tabs, you can find detailed information on these ETFs and sort them according to your desired criterion. More information about the different criteria when choosing an ETF can be found in our article on ETF selection.Source: justETF.com; As of 31-03-2025
