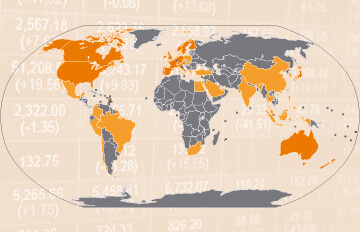
Top MSCI ACWI IMI ETFs
The MSCI ACWI IMI Factsheet
The MSCI All Country World Investable Market Index (ACWI IMI) is an international stock index that tracks the performance of of companies from developed and emerging markets worldwide. It combines the following equity universes:
- MSCI World (large and mid cap companies from developed markets)
- MSCI Emerging Markets (large and mid cap companies from emerging markets)
- MSCI World Small Cap (small caps from developed markets)
- MSCI Emerging Markets Small Cap (small caps from emerging markets)
While ETFs are available for each of the four indices, the MSCI ACWI IMI combines all four indices. As a result, the index covers 8.406 constituents (as of 31-03-2025) and 99% of the investable market capitalisation worldwide and is a perfect all-in-one solution for those who want to achieve maximum diversification with a single world ETF in their portfolio.
Explained: MSCI World, MSCI ACWI & MSCI ACWI IMI

ETF investors can benefit from price gains and dividends of the MSCI ACWI IMI constituents. Currently, the MSCI ACWI IMI index is tracked by 2 ETFs.

MSCI All Country World Investable Market (ACWI IMI) Chart 1 year
Source: justETF.com; As of 11-05-2025; Performance in EUR, based on the largest ETF.
Cost of MSCI ACWI IMI ETFs
The total expense ratio (TER) of MSCI ACWI IMI ETFs is at 0,17% p.a.. In comparison, most actively managed funds do cost much more fees per year. Calculate your individual cost savings by using our cost calculator.
MSCI ACWI IMI ETFs in comparison
Besides return, there are further important factors to consider when selecting a MSCI ACWI IMI ETF. In order to provide a sound decision basis, you find a list of all MSCI ACWI IMI ETFs with details on size, cost, age, use of profits, fund domicile and replication method ranked by fund size.
Compare all MSCI ACWI IMI ETFs in detail
Compare all MSCI ACWI IMI ETFs in a chart
Source: justETF.com; As of 11-05-2025
Return comparison of all MSCI ACWI IMI ETFs
The table shows the returns of all MSCI ACWI IMI ETFs in comparison. All return figures are including dividends as of month end. Besides the return the reference date on which you conduct the comparison is important. In order to find the best ETFs, you can also perform a chart comparison.
Source: justETF.com; As of 30-04-2025; Calculations in EUR including dividends