
- Level: Advanced
- Reading duration: 6 minutes
What to expect in this article
Performance of bonds and equities in Emerging Markets
Equities are for growth and government bonds are for defence, right? Everyone knows that! My grandma’s cat knows that. Except, there’s a place where that rule does not hold. And that place is the Emerging Market. Here’s the data (EM bonds are the orange line, equities are blue):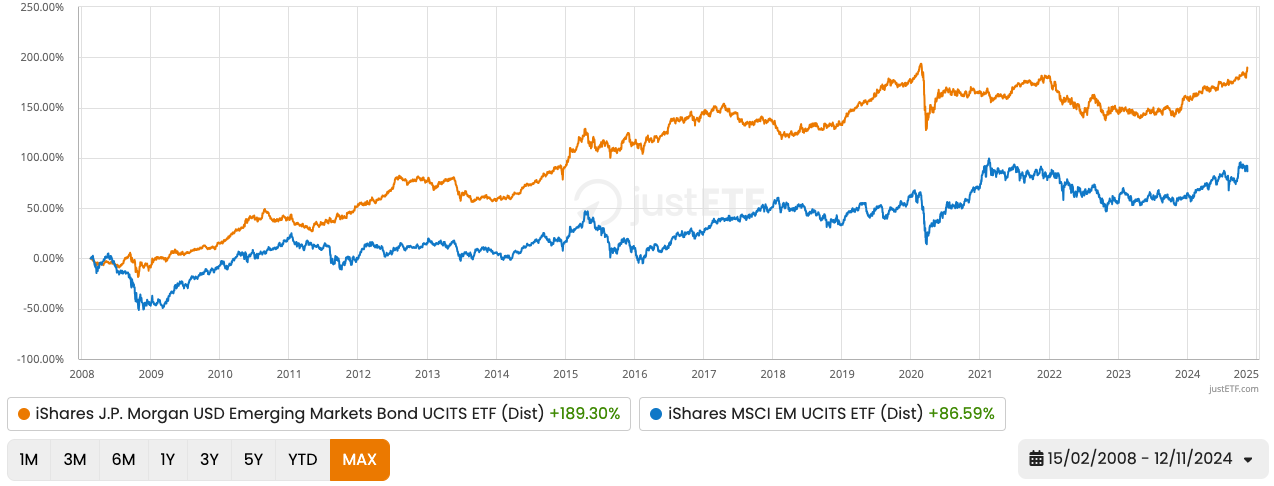
Source: justETF Research, 13/11/2024. Returns in EUR
The chart shows the longest possible comparison between an Emerging Market equities ETF (IEEM) and an Emerging Market US$ denominated sovereign bonds ETF (SEMB).
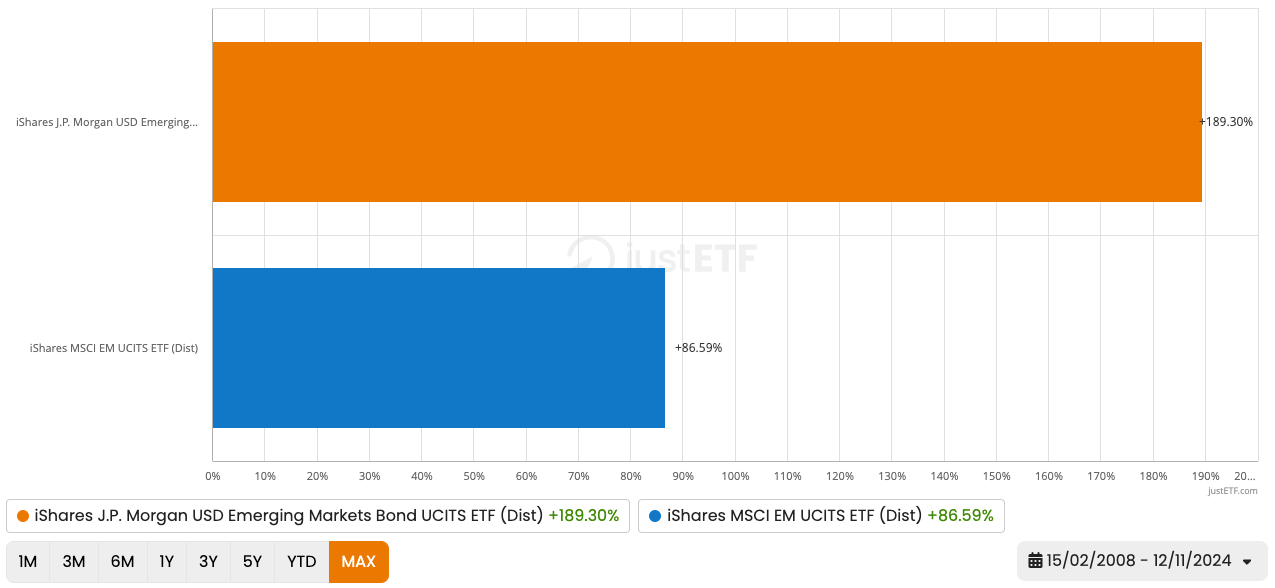
The bond ETF has delivered twice the return of the equity's product over 16 years:
Source: justETF Research, 13/11/2024. Returns in EUR
That’s a 189.3 % cumulative return for Emerging Market US$ sovereign bonds vs 86.6 % for Emerging Market equities.
Incredibly, the EM bond ETF has delivered better returns for less risk than its equities rival, too:
| Asset class/ETF | Annualised return (%) | Risk (%) | Return/risk | Max drawdown (%) |
|---|---|---|---|---|
| EM US$ sovereign bonds (SEMB) | 6.55 | 10.20 | 0.64 | -22.68 |
| EM equities (IEEM) | 3.79 | 18.59 | 0.20 | -59.08 |
Source: justETF Research, 13/11/2024. Returns in EUR (15/02/08–12/11/24)
The return/risk ratio shows that EM bonds were a much cushier ride than EM equities. The higher that number, the better your risk-adjusted returns. Or, to put it another way, the less risk you took for every percentage point of return gained.
And who wouldn’t want to own an investment that grew your wealth faster, while causing less pain than the alternative?
justETF Tipp: Emerging Market US$ sovereign bonds = Emerging Market government debt and government guaranteed debt that is denominated in US dollars. This is different from EM local sovereign bonds, which are denominated in the issuing country’s home currency. Local EM debt tends to be the more volatile asset class.
Reasons for the success of Emerging Market bonds
The trend holds true using index data going back to 1994 (before Emerging Market ETFs even existed). Moreover, there are tangible diversification benefits to allocating to EM US$ sovereigns instead of (or in addition to) EM equities. Emerging Market equity ETFs are typically heavily exposed to Asian firms. EM US$ bond ETFs split more evenly across emerging markets while leaning into Latin America and the Gulf States. And if you hold a global ETF, then it’s worth knowing that EM US$ sovereign debt is historically less correlated with that asset class than Emerging Market equities. State Street report 20-year EUR return correlations with the MSCI World as follows:- EM US$ bonds: 0.52
- EM equities: 0.73
What future developments can be expected?
You know there’s a “but” coming… The big “but” is we can’t know that EM bonds will continue to outperform EM equities in the future. In fact, the spoils have gone to EM equities in recent years. A three-year comparison shows a neck-and-neck race: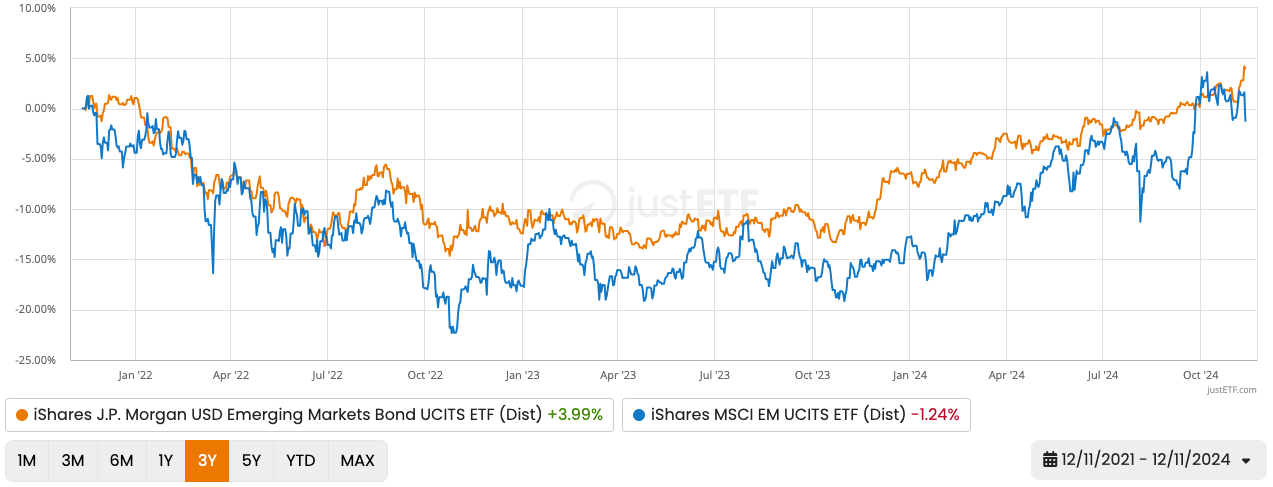
Source: justETF Research, 13/11/2024. Returns in EUR
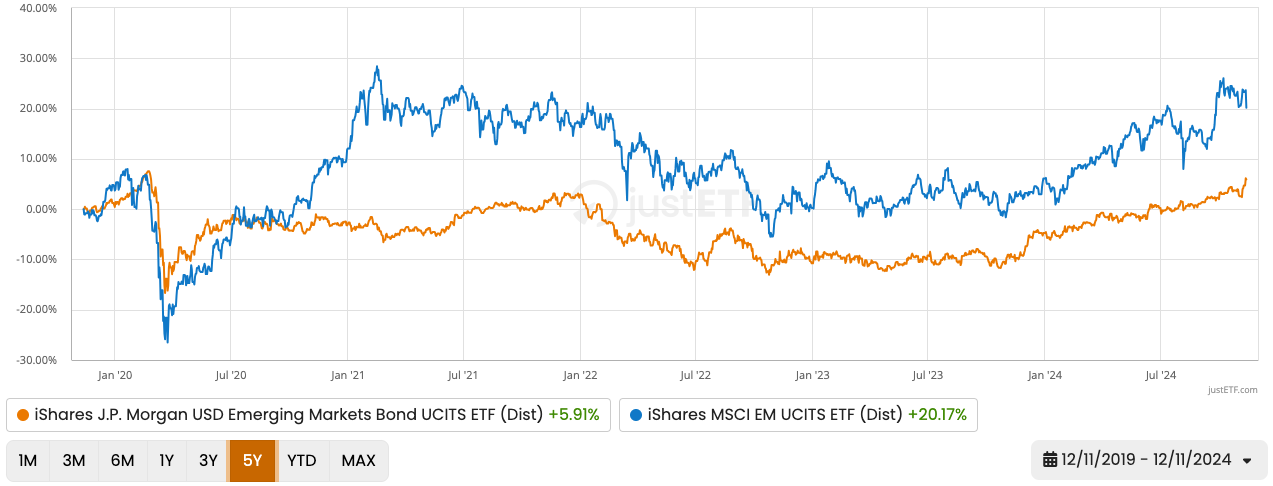
But equities have dominated over five years:
Source: justETF Research, 13/11/2024. Returns in EUR
Recovery from COVID, deglobalisation, inflation, and the outbreak of the Russia-Ukraine War weighed more heavily on EM US$ debt than EM equities.
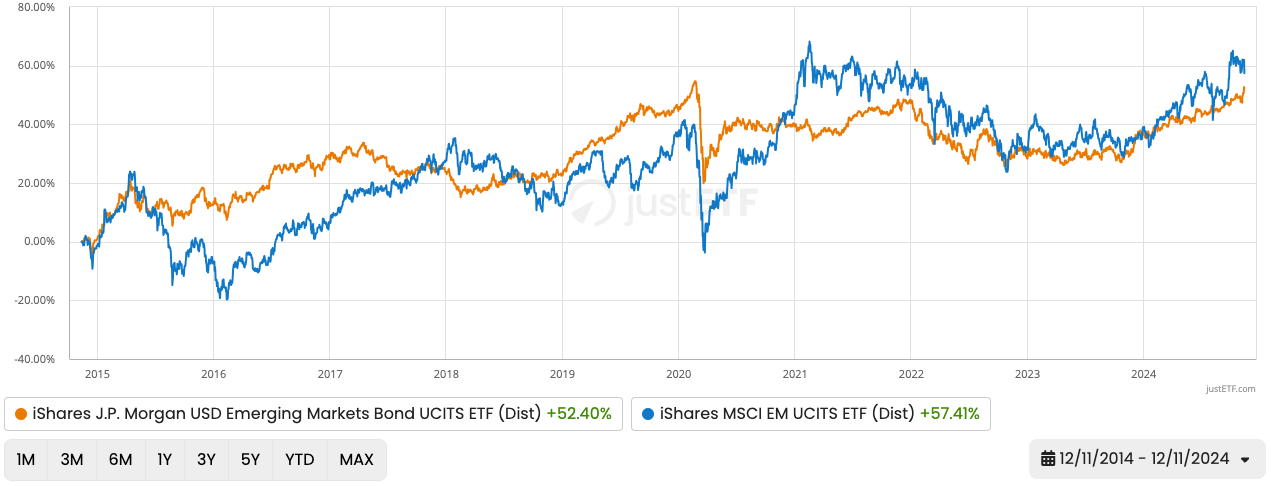
Equities also scored a significant victory over the last 10 years:
Source: justETF Research, 13/11/2024. Returns in EUR
Profits were 20 % higher in the equities ETF versus its bond rival in this case.
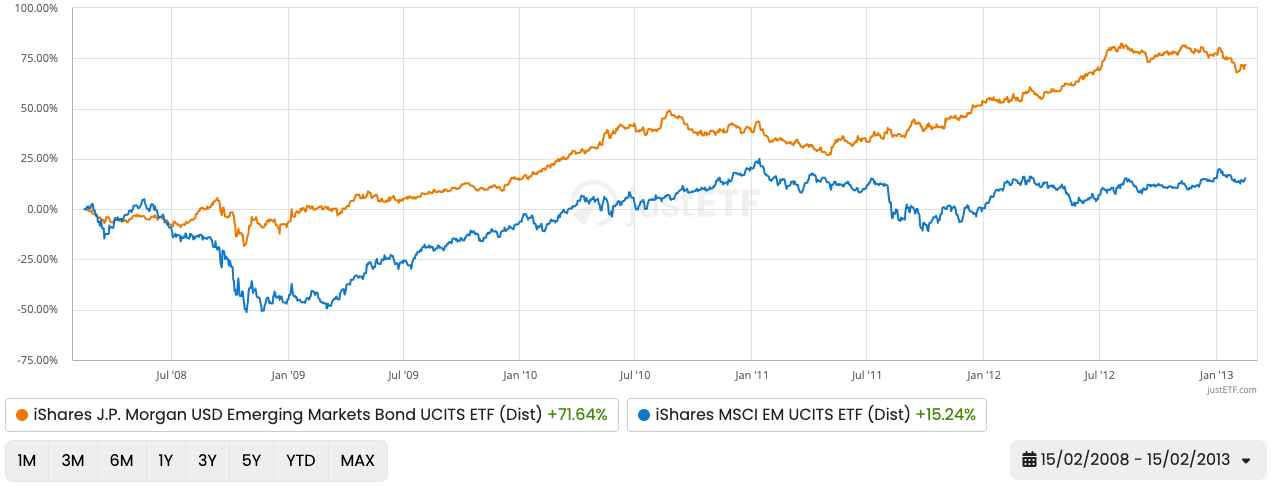
Finally, we can see that EM debt substantially built its lead in the first five years of the comparison:
Source: justETF Research, 13/11/2024. Returns in EUR
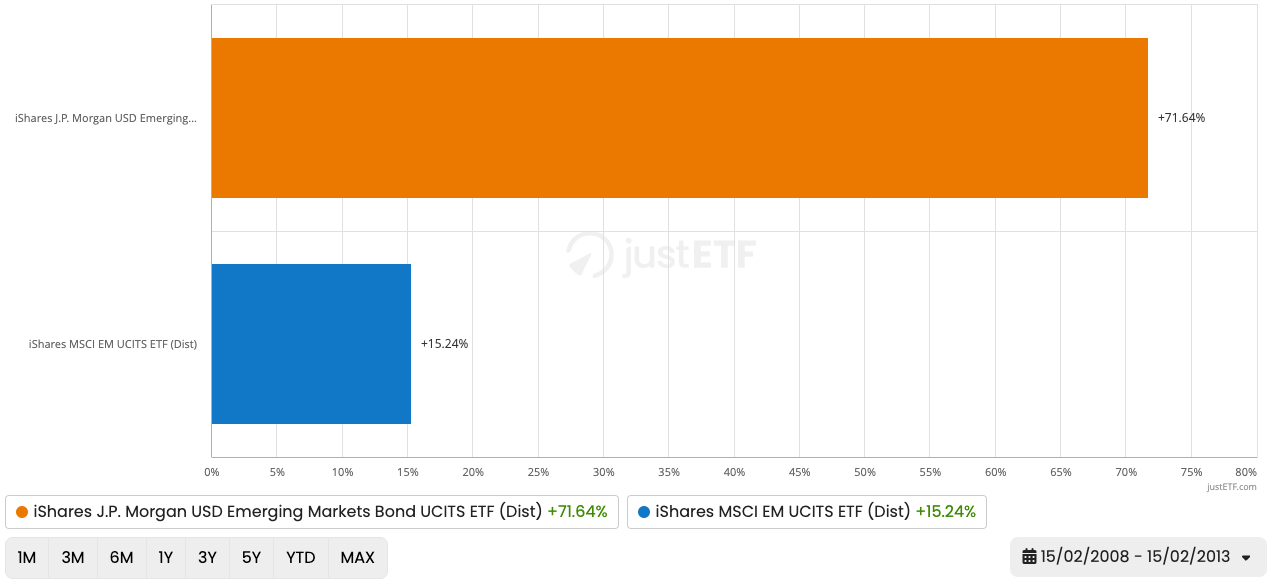
The bond return was 371 % greater than the equity return from 2008 to 2013:
Source: justETF Research, 13/11/2024. Returns in EUR
Why? Because Emerging Market government finances recovered more quickly than expected from the 2008-09 Global Financial Crisis (GFC). EM US$ bond yields peaked at the height of the panic in October 2008. You can see that was the lowest point for EM debt prices in the line chart above (orange line).
Rising bond yields mean falling bond prices, while falling bond yields mean rising bond prices. EM yields fell steadily for the next four years propelling the bond ETF upwards.
That said, the catch is clear: EM US$ bonds may not maintain their historical advantage over EM equities. Indeed, that advantage has not materialised over the past decade, as the snapshot above shows.


