
- Level: For everyone
- Reading duration: 4 minutes
What to expect in this article
Why we should diversify
One reason we globally diversify is because of country risk: the chance that any single country’s stock market can be dealt a devastating blow – a blow from which it takes years to recover. Japan is the ultimate example. The Japanese stock market was the most valuable in the world in 1989 – even eclipsing the US.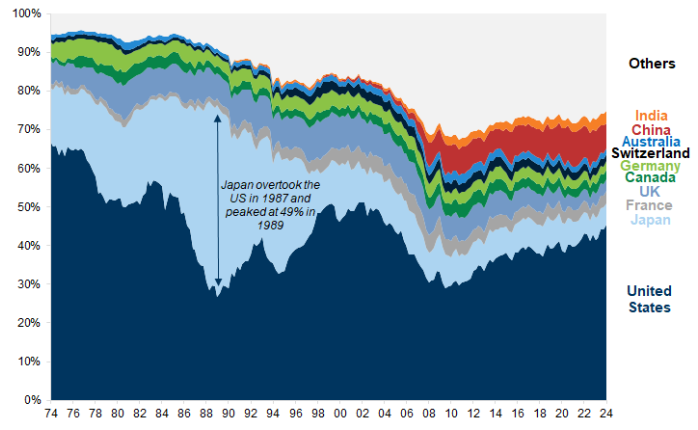
Source: Goldman Sachs, as of 2024
Japanese stock prices had risen an astonishing 410 % since 1982 as Corporate Japan outcompeted their global rivals.
Investors rushed in and were richly rewarded. If you invested ¥150,000 (€950) in 1982, the value of your Japanese stocks would have grown over four times to ¥715,255 (€4,540) as the market peaked on New Year’s Eve 1989.
But latecomers had been sucked into a stock market bubble. The bubble burst and Japanese stocks began a losing streak that lasted 13 years.
Recovery took longer still. In fact, the Japanese stock market only surpassed its previous high in 2021 – over 31 years later.
Here’s the chart:
Japanese stock market returns 1980–2024
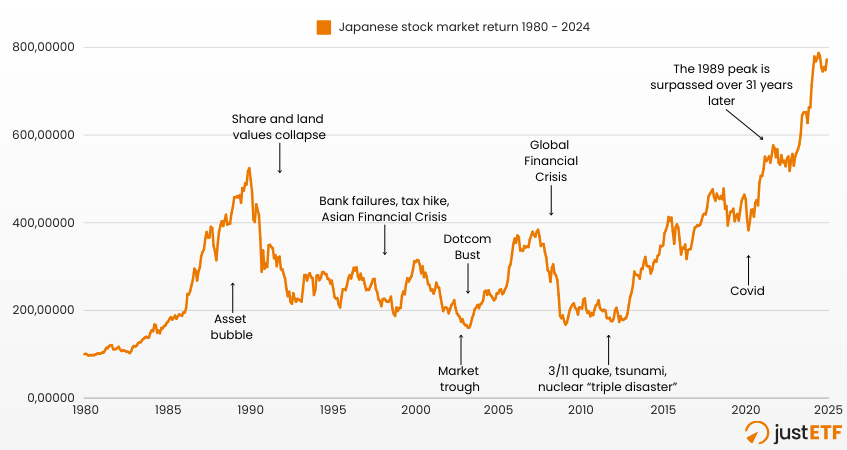
Source: justETF research 10/02/2025. Russell/Nomura Japan stock index (inflation-adjusted, dividends reinvested).
You can see how quickly the bubble inflates on the left-hand side of the chart. The trend line ascends near vertically from 1986 until the 1989 peak.
Prices collapsed 45 % in just seven months from December 1989 to September 1990. But the stock market didn't hit bottom until 2003 in the midst of the Dotcom crash. That’s a 69 % loss from peak to trough.
Japanese stocks fought back from that low point – ascending 139 % until June 2007. However, that ground was almost all lost when the Global Financial Crisis struck.
Stocks rallied in 2009 but, in Japan, the recovery was snuffed out by the triple disaster of the 2011 Tohoku Earthquake, Tsunami, and Fukushima nuclear meltdown.
As a long-suffering Japanese investor, you would have been forgiven for just giving up. Yet the market had finally reached a turning point, as it always has done.
Slowly but surely prices climbed until Japan’s stock market crested its December 1989 peak in February 2021. And the upward trajectory has continued since.
justETF tip: Some mark the recovery date of the Japanese stock market as February 2024. But this is only the case if you measure the Nikkei 225 index of Japanese equities without including reinvested dividends or adjusting for inflation. An accurate assessment of the investor experience includes dividends and inflation.
100% Japan versus the World
Although the bursting of the Japanese stock market bubble was an astonishing fall from grace, there are many different ways to protect yourself from that kind of event. The most obvious defence is to diversify away from any single country using a global ETF. Indeed, the next chart shows how a Japanese investor would have benefited from that very strategy:MSCI World vs. Japanese stocks 1980–2024
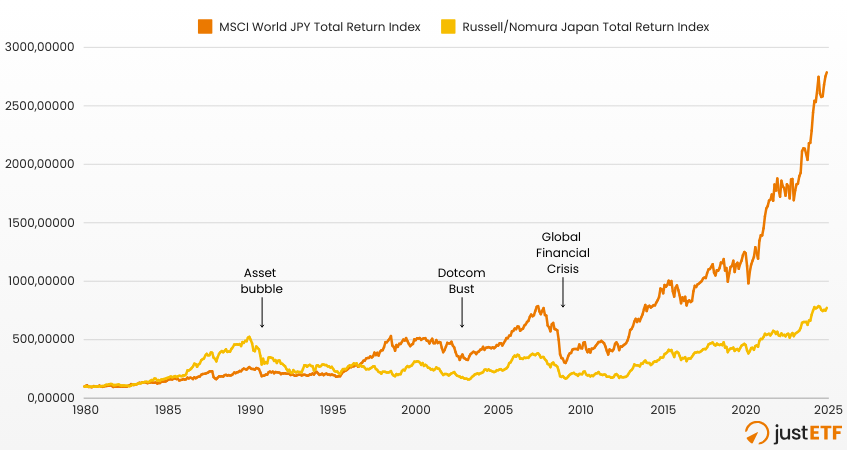
Source: justETF research 10/02/2025. MSCI World index (denominated in yen, inflation-adjusted, dividends reinvested).
This time, we compare the same Japanese stock market returns (yellow line) against the MSCI World (JPY) index representing a globally diversified equity portfolio (orange line).
A big bet on Japan looked like the smart move in the 1980s as the bubble inflated. The 100 % Japan investor was worth twice as much as their globally diversified counterpart at the height of the mania.
Still, it wasn’t long before the 100 % Japan strategy proved short-sighted. As it happened, even the global investor took a 29 % hit in 1990, mostly because tumbling Japanese stocks accounted for 40 % of the MSCI World back then (the allocation is around 5 % today).
But the World index decisively overtook Japan in 1996 and hasn’t surrendered its lead to this day.
In fact, the World beats Japan over every long-term timeframe you care to look at for the past forty years:
World vs. Japan: annualised real returns (yen)
| Stock index / Time | 10 years | 20 years | 30 years | 40 years |
|---|---|---|---|---|
| World (JPY) | 11.6 % | 9.5 % | 9.1 % | 7.6 % |
| Japan | 8.3 % | 6.0 % | 3.6 % | 3.8 % |
Source: justETF research 10/02/2025.
Remember that the average historical real return for Developed World stocks is around 5 % annualised. By that yardstick, Japanese stocks have fared well over the past 20 years.
But the World return has been exceptional across all time frames – which means it would have delivered for Japanese investors even while their home market was battered.
Of course, it’s worth adding that very few investors put all their money into the stock market just as a bubble bursts.
The vast majority contribute a monthly sum over many years. This drip-feeding strategy enables you to buy more ETF shares when market prices are low versus when prices are high.
It’s a “buy low, sell high” technique that pays off when markets eventually recover, and it would have greatly benefited Japanese investors who held their nerve during tough times.
And that’s not all you can do. It’s because stock markets are risky that we also hold other assets such as bonds, gold, and commodities.
These assets are useful precisely because their fortunes aren’t tied to stock market performance, and so they can rise in price when equities are laid low.
Ultimately, though, the Japanese stock bubble illustrates why we should never depend on any single market.
The rise of Japan’s stock superstars seemed unstoppable in the 1980s, and Corporate America was thrown on the defensive. Now it is the US tech titans that seem untouchable – but no reign lasts forever and that is why we diversify.


