What to expect in this article
How cost-averaging works with ETFs
Imagine you regularly save 300€ a month into your portfolio. Over 20 years, your total contribution is 72,000€. While it might be great to put the entire 72,000€ to work straightway, most people will find it easier to drip-feed in a regular amount from their income. Your 300€ is invested monthly, so each contribution buys a varying number of ETF shares as prices fluctuate. When the market tumbles, your 300€ drip-feed buys more shares than it can when markets are rising. For example: a buy price of 5€ nets you 60€ shares for 300€. Whereas you’ll only purchase 30 shares when your ETF is priced at 10€ a pop. So long as you do not sell your ETF shares when the market is down, you will profit when it rebounds. Intuitively it feels wrong to throw more money at the market when prices are falling. But the opposite is true. As long as prices recover, then cost averaging will help your portfolio make better returns than if you sat in cash. That’s because your purchases during market dips lower your average buying price. As soon as the ETF’s price rises above your average buying price then you’re back in profit. Indeed, those 5€ ETF buys made at the market bottom register a profit of 100% when the price bounces back to 10€ a share. Thankfully, prices have always recovered after a crisis, as the economy improves, and investor confidence returns.justETF tip: The cost-average effect is the gain investors make from regular investments into a security as it fluctuates in value.
Cost-averaging: its impact over the last 30 years
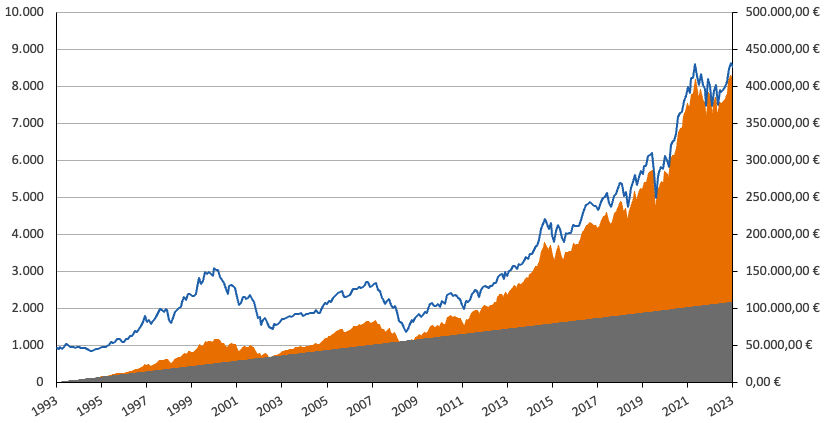
We simulated the impact of cost averaging on regular ETF investment contributions starting in 1993 (in Euro). That period includes historic market crashes such as the bursting of the Dotcom Bubble (2000-02), the Global Financial Crisis (2008-09), the European Debt Crisis (2011), and the Coronavirus Crash (2020). This switchback sequence of ‘90s growth, noughties volatility, and recovery in the 2010s is the ideal test of cost-averaging. We assume a regular investment contribution of 300€ a month into a MSCI World ETF. Cash contributions total 108,000€ over 30 years. ETFs didn’t exist in 1993 so we use the MSCI World index returns minus an annual Ongoing Charge Figure (OCF) of 0.2%. Despite the many crises along the way, world equity returns have nearly quadrupled that cash stake from 108,000€ to 408,672€. The deep dips during the darkest periods of the Dotcom Crash and the Global Financial Crisis enabled shares to be purchased for a song. Strong growth in the recovery stages returned outsized profits to investors who kept going during the downturns. The psychological benefit of cost-averaging is at least as beneficial as it’s impact on wealth. There’s no need to second-guess the markets. No need to panic and sell out at the first sign of trouble. No sitting on the sidelines during a recovery fretting about whether it’s too soon to dive back in. Or worse, that you’ve already missed the boat. Instead, you remain committed, keep investing through fair weather and foul, and wait for your ‘buy low’ strategy to pay off over the long-term. But would your portfolio’s value have gone into the red for long periods during the dips? Psychologically that can be difficult as you wonder if the market will ever recover. But in our simulation that situation hardly occurred – as shown in this chart:30 years of cost-averaging, MSCI World (in EUR), 300€ monthly contributions

Amount saved in EUR Value of the units in EUR MSCI World EUR
Sources: MSCI, Deutsche Bundesbank, justETF Research (31.08.2023)
- The grey area shows the value of monthly cash contributions.
- The orange zone is the portfolio’s value as represented by our simulated MSCI World ETF.
- The blue line plots the price trend of the MSCI World index. The scale is shown on the left-hand axis.
30 years of ETF savings: the result
| Monthly savings rate | 300€ |
| Product | MSCI World ETF, OCF 0.2% p.a. |
| Start | 31/08/1993 |
| End | 31/08/2023 |
| Savings period (years) | 30 |
| Amount saved | 108.000€ |
| End value | 408.672€ |
Sources: MSCI, Deutsche Bundesbank, justETF Research 31.08.2023
Naturally, every investor’s outcome is path dependent. Individual results rely on the investments chosen, returns over time, and your trading history. In that respect, it would be wrong to suggest that cost-averaging alone can overcome all setbacks.
But the cost-average effect will always be positive so long as you keep investing regularly and do not sell during a crisis.
A falling share price may mean paper losses in the short-term, but these turn into real gains later. A down market is precisely the time you sow the seeds for future success – by buying assets when they’re on sale.
justETF tip: Discover everything you need to know about regular investing in our ETFs for Beginners guide. You’ll find everything clearly explained in articles, videos and podcast episodes.


