
- Level: For all
- Reading duration: 10 minutes
What to expect in this article
The valuations dilemma
If you search “expected return forecasts” you’ll discover no shortage of big-name investment firms offering 10 to 30 year predictions for the major asset classes. Most of these predict that non-US equities will grow faster than US equities. Game over? Ditch the American stuff faster than deep-fried Oreos after a heart murmur? Not so fast. These forecasts are typically based on valuation models. Valuation models are fed by metrics that attempt to estimate the underlying economic value and financial health of individual firms and markets. These measures are often called the “fundamentals”. The fundamentals include the Price-to-Earnings (P/E) Ratio, Earnings Per Share (EPS), Price-to-Sales (P/S) Ratio, the Dividend Yield, and Return on Equity (ROE) among others. So when you hear market commentators talking about the “fundamentals” they’re normally referring to their own brew of commonly known financial data points (unless they’re just hand-waving). Meanwhile, mentions of “valuations being stretched” or the market being “fair value”, allude to how those fundamental metrics compare to historical averages. And by most lights, US equities look expensive versus the long-run averages. Thus, sluggish future growth is forecast because the metrics appear to be tightening like a leash. For example, if investors pay record (stock) prices for (company) earnings, then the assumption is that can’t continue forever. Company earnings growth will surely slow and stock prices subsequently flatten. But the models have a problem. The predictive power of stock market valuation signals is weak. Among the most credible metrics is the Cyclically Adjusted Price-to-Earnings (CAPE) ratio. Research has shown the CAPE ratio explains around 48 % of subsequent 10-15 year returns in developed markets. That’s as good as it gets! Many rival formulas predict less than 20 % of the variation in future stock market returns. The point is that valuation models have virtually nothing to say about short-term returns and are the proverbial coin toss when it comes to longer-run returns. Hence, the dilemma. Yes, S&P 500 stocks seem pricey by conventional measures. And the Magnificent 7 have driven over 70 % of S&P 500 returns since the beginning of 2023.Performance of "Magnificent 7" stocks in S&P 500
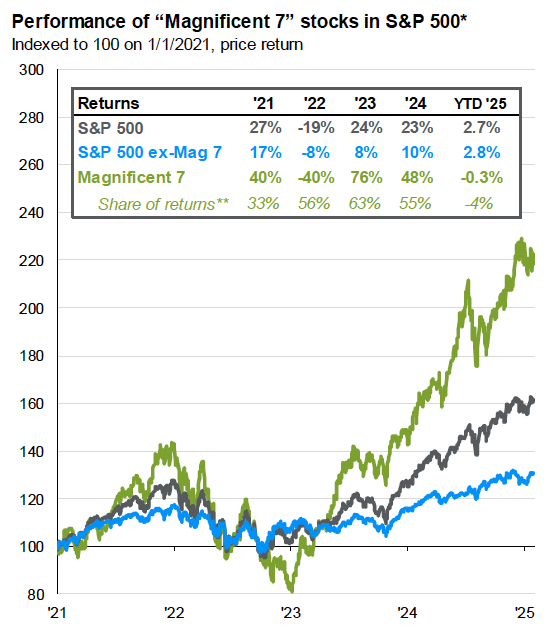
Source: J.P. Morgan Guide to the Markets, 27 February 2025
While near-term growth of the global indices will be heavily influenced by the megacap tech stocks. Yet the best available forecasts cannot be confidently relied upon.
What can?
Market truths
The reason proprietary forecasts aren’t dependable is because they can’t predict the future. Because the future is fundamentally unpredictable. When tariffs wipe billions from stock market values, it’s because that’s a new development. Previously, the market priced in a chance that tariffs could be implemented. But there was also a chance the threat was idle. Nobody could say for sure. Not until Trump decided. At that point, the odds of a trade war narrow, and the stock prices of the most exposed firms respond to the new reality. This process never ends. Perhaps tariffs will be lifted. Perhaps the tit-for-tat exchange will be worse than predicted. Now scale up that dynamic by every other event that affects stock prices. If investments in AI produce a pipeline of profitable product developments - that exceed current expectations - then the stocks of firms set to benefit will rise. But perhaps generative AI hits a wall. Or people are reluctant to use and pay for those products in the wider economy. Or the US AI firms are undercut by cheaper Chinese rivals. These are just a few of the scenarios that could usher in a period of weaker US equities growth - because investors decide those assets are less valuable than previously thought. The sum of this complexity makes it very difficult for any single person or institution to beat the market. Individuals are likely to underperform the aggregate judgements and resources of the other participants over time. Because it’s the collective actions of all participants that ultimately make the market, and they represent an unparalleled source of different perspectives. This group insight is known as “the wisdom of the crowd”. The sheer demonstrable difficulty of individual outperformance reveals that your best guide to the future is the market’s current judgement, its current allocation of capital. Thus, if the balance of global investing opinion believes that the US is the best place for 66 % of their money right now, then you aren’t likely to find a better informed suggestion. And by holding 34 % of their investments elsewhere, market participants are signalling that while they believe US stocks are a good place to be, it’s not the only game in town. Diversification still matters. This passive investing philosophy, as expounded by the likes of investing great Warren Buffett, explains why sticking to a buy-and-hold strategy is a smart way to resolve investing dilemmas.Is the market always right?
You could rightly point out that the market can go temporarily crazy - as in the Japanese stock market bubble or during the run-up to the Dot-Com Bust. Prices can - for a time - disconnect from reality, especially during the hype phase of a revolutionary technology like AI. So you could manually decide to limit your exposure to US stocks at a certain point. After all, what if the market pushes the US allocation up to 80 % or 90 %? In this case, you aren’t claiming to know better than the market. But that you’re personally more comfortable with a bedrock level of diversification. As a non-US resident, it may well make financial sense to spread your currency exposure well beyond the dollar anyway. With that stage set, let’s see if the historical returns of the MSCI World USA help inform our decision.MSCI World ex USA versus MSCI World
The available MSCI ex USA ETFs launched in 2024, hence they don’t have much of a track record yet. But we can examine how the MSCI World ex USA index has stacked up since 1970 - benchmarked against its US-inclusive counterpart, the MSCI World. Here’s the growth chart for the two indexes:MSCI World ex USA vs MSCI World Total Returns (1970-2024)
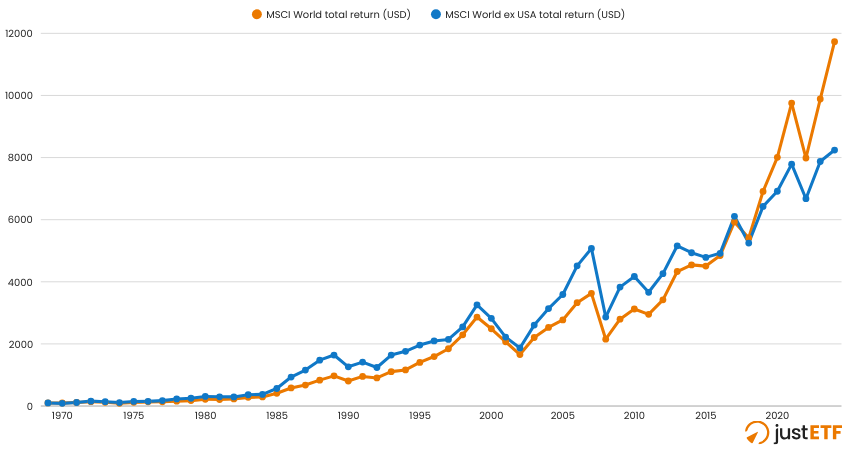
Source: justETF Research
The two indexes have tracked each other quite closely over the past 55 years. Intriguingly, you can see that the World ex USA (blue line) was actually in the lead for most of this period.
The US-dominated MSCI World (orange line) only accelerated ahead from 2018. These are the key numbers:
| MSCI World | MSCI World ex USA | |
|---|---|---|
| Average annualised return | 9.1 % | 8.4 % |
| Cumulative growth | $1 grew to $117 | $1 grew to $82 |
| Volatility | 17.3 % | 20.4 % |
| Max. drawdown | -40.7 % | -43.6 % |
MSCI World ex USA vs MSCI World: 3 year rolling returns (1972-2024)
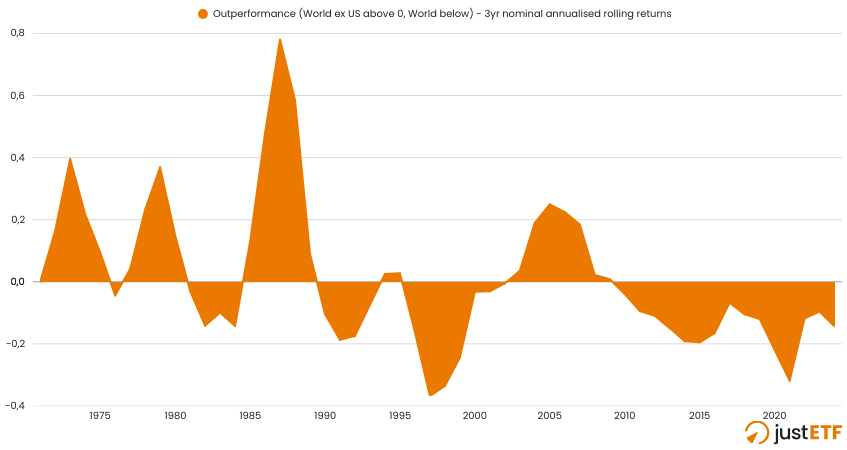
Source: justETF Research
The lead has changed hands quite frequently in the past. The MSCI World ex USA has beaten the MSCI World whenever the blue shaded area is above the 0 % line. By extension, that means non-US stock returns outpaced US stock returns during those years, on average.
The chart shows that the last changeover occurred in 2010. At 15 years, this is the longest period of sustained success for either index.
Does that mean US equity growth will continue forever? No.
Will the lead change again soon? Nobody knows.
What we can say is that it’s perfectly normal for the lead to switch between the US and the rest of the world, so it’s likely to happen again.
Head-to-head index comparison
| MSCI World | MSCI World ex USA | |
|---|---|---|
| Number of equities | 1465 | 855 |
| Weight of the top 10 | 21.47 % | 13.80 % |
| Top 5 countries | USA (70.89 %), Japan (6.13 %), UK (3.79 %), France (3.16 %), Canada (3.06%) |
Japan (21.07 %), UK (13.01 %), France (10.85 %), Canada (10.52 %), Switzerland (8.38 %) |
| Top 5 industries | IT (23.68 %), Finance (15.36 %), Health (11.99 %), Industry (11.22 %), Cyclical consumer goods (10.73 %) |
Finance (21.03 %), Industry (16.45 %), Cyclical consumer goods (11.57 %), Health (11.35 %), IT (9.41 %) |
| TER | 0.1-0.5 % | 0.15 % |
Source: justETF Research, MSCI Factsheets; 29 March 2024
Immediately, you can see that the MSCI World ex USA index is less concentrated in its top 10 stocks and is more evenly split across its top 5 country weights.
In particular, its tech sector (or IT sector) is 60 % smaller.
Thus, if you’re worried that the US tech or AI story is overblown, then the MSCI World ex USA is a reasonable way of addressing your concern.
How a customised US allocation works
Let’s say you want to customise your allocation and reduce your US position to 50 % of your total equities' portfolio. You can do this by choosing an S&P 500 ETF (100 % US) and a MSCI World ex USA ETF (0 % US). By holding equal amounts of both, you’d establish a 50 % US equity allocation:- 100 % S&P 500 x 50 % = 50 % US
- 100 % MSCI World ex USA x 50 % = 0 % US
- Go to the justETF portfolio builder.
- Pop your ETF names in the Search bar. You don’t need to type them in exactly. Just the words, “S&P 500” will dial up a list of suggestions.
- Type your desired asset allocations into the “Weights in %” fields.
- Hey Presto! The app automatically converts your percentages into the correct monetary totals - if you feed your existing portfolio balance into the “Investment amount” field. (Not pictured.)
Our conclusion
We believe in holding the market portfolio as a baseline position. But we also accept it’s a nuanced decision. There are many financial and personal reasons why any single individual may wish to deviate from the market to some degree. There’s no right and wrong here. It’s a question of your personal viewpoint, circumstances and balance of risks. With that in mind, you may find this summary decision framework helpful:| Consider switching to the World ex USA | Stick with a global ETF |
|---|---|
| You want to reduce US market dominance | You believe the market is efficient |
| You believe the US market is overvalued | You value set-and-forget simplicity |
| You seek broader currency diversification | You want full exposure to global megacaps |
| You’re concerned about US political or economic risks | You regret it whenever your investments fall short of broad market benchmarks |
| You want to customise your asset allocation | You don’t want to actively rebalance between US and ex US positions |


