Choose your individual criteria and easily compare several ETFs in our ETF Screener.
With the ETF comparison function, you have a powerful tool at your disposal with which you can compare ETFs according to individual criteria at a glance.Select ETFs for comparison
To mark an ETF for comparison, click on the box next to each ETF in the ETF screener in the search results. Alternatively, you can click on "Compare" in the ETF profile.For detailed instructions on how to use our search function in order to find the ETFs that match your investment strategy, please refer to our “Introduction to the ETF search”.
Once you have selected an ETF, you can continue to navigate through the ETF search and add new ETFs to your selection at any time.
To compare your final selection, select the basket at the top of the ETF search. Select "Compare Selection" from the drop-down menu to go to the comparison overview.
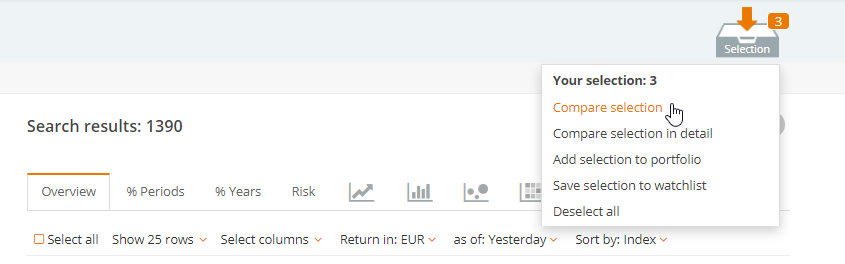
Cancel selection
To remove an ETF from your selection, simply uncheck the box for that ETF.To remove all your selections, click on the basket in the upper right corner and select "Remove Selection". You reset the basket and can start the ETF selection again.
Of course, you can customise the comparison criteria according to your needs. You can learn more about this in our tutorial "ETF Screener options".
Compare ETFs: tabular comparisons
As soon as you click on "Compare selection", only the ETFs you have previously selected will be displayed in the overview. This allows you to easily compare ETFs from different asset classes, such as bond and equity ETFs.In addition to the customisable selection overview, you can also use the specialised comparisons according to performance and risk.
Under the "% Periods" tab you can compare the performance of the individual ETFs in your selection by a period. By default, the system calculates back from yesterday, i.e. the last six months are used for a 6-month performance. Alternatively, you can display the return at the end of the month here.
Under "% Years", you can compare performance by the calendar year and see at a glance how the individual ETFs have developed in recent years.
Under "Risk" you will find information on the average volatility of the ETFs over various periods. These are positive and negative deviations from the average return.
Compare ETFs: graphical comparisons
In addition to the tabular comparisons of return and risk, our chart comparisons are available in the ETF search.In the "Chart comparison using a line chart", you can graphically display the performance of ETFs over various time periods. Click on an ETF name in the legend to hide this ETF. The ETF thus remains part of the selection.
In the "Chart comparison using a bar chart", you can see the performance of the ETF directly compared.
justETF Premium users also have access to the interactive risk cloud and the so-called "heat map", which compares the monthly returns of your selected ETFs.