
What to expect in this article
Beating inflation vs hedging against inflation
There are two ways to deal with inflation:- Beat it over the long-term with an asset class that will probably deliver returns well in excess of inflation over time.
- Hedge against inflation with asset classes that protect against it in the short-term.
MSCI World growth vs inflation in Germany
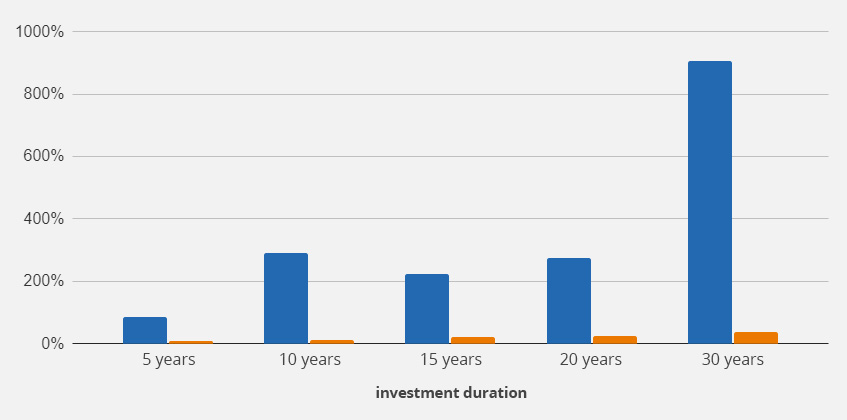
MSCI World
Inflation
Remember that equities do not hedge against inflation. Therefore they can and do underperform during periods when inflation runs hot.
The key: The long-term real return of diversified world equities is comfortably ahead of other asset classes over many decades and business cycles. And that includes periods when inflation span out of control such as after both World Wars and during the 1970s.
Ultimately, equity investors beat inflation because profits generated by firms adapt to and overcome price pressures.
While profits are temporarily hurt by rising production costs and wages, competitive firms restore their earnings by passing on price increases to consumers.
Moreover, inflation is a growth signal. It spurs business to resolve supply-bottlenecks and meet excess demand. That sets the stage for future growth.
![MSCI vs asset classes]()
![MSCI vs asset classes max]()
![MSCI vs euro inflation-linked etf]() The anti-inflation mechanism embedded in index-linked bonds is working as advertised but it can be overwhelmed by the capital losses inflicted by rising yields.
Behind-the-scenes, ETF managers are selling off older bonds (now at lower prices) and buying in new, higher-yielding bonds.
That process ultimately makes investors better off as they receive stronger cashflows from higher yielding bonds. But it takes time.
However, in the short-term, bond fund returns are dented by the drop in the value of their holdings.
Recent bond ETF performance tells us two things:
The anti-inflation mechanism embedded in index-linked bonds is working as advertised but it can be overwhelmed by the capital losses inflicted by rising yields.
Behind-the-scenes, ETF managers are selling off older bonds (now at lower prices) and buying in new, higher-yielding bonds.
That process ultimately makes investors better off as they receive stronger cashflows from higher yielding bonds. But it takes time.
However, in the short-term, bond fund returns are dented by the drop in the value of their holdings.
Recent bond ETF performance tells us two things:
![MSCI vs bond ETF]()
![MSCI vs Real Estate]()
Inflation
Source: justETF Research, MSCI World index, 21.11.21.
Result: The longer you stay invested in equities – which is most best done via ETFs –, the more likely it is that your profits will comfortably outpace inflation. This is a major reason why a diversified equity allocation is the mainstay of growth orientated portfolios.
Because equities are risky, investors demand a real return that outstrips inflation and makes the pain of holding them through short-term dips worthwhile.
justETF tip: The real return is an asset’s nominal return minus inflation. In other words, it’s your return adjusted for inflation.
justETF tip: As long as your portfolio is mostly built on diversified ETFs such as the MSCI World, then you’re positioned to reap the rewards from firms that crack these challenges.
Hedging against inflation
Inflation-hedging is a more complex and less reliable strategy than beating inflation over the long-term. Hedging relies on pre-loading your portfolio with asset classes that respond quickly to high inflation with strong returns that offset some of the damage.Reputed inflation hedges include:
The anti-inflation properties of these asset classes fall into three buckets:
- Unreliable hedge with questionable long-term growth prospects
- Reasonable hedge but not guaranteed to work every time
- A myth
Inflation-hedge bucket no1: the unreliables
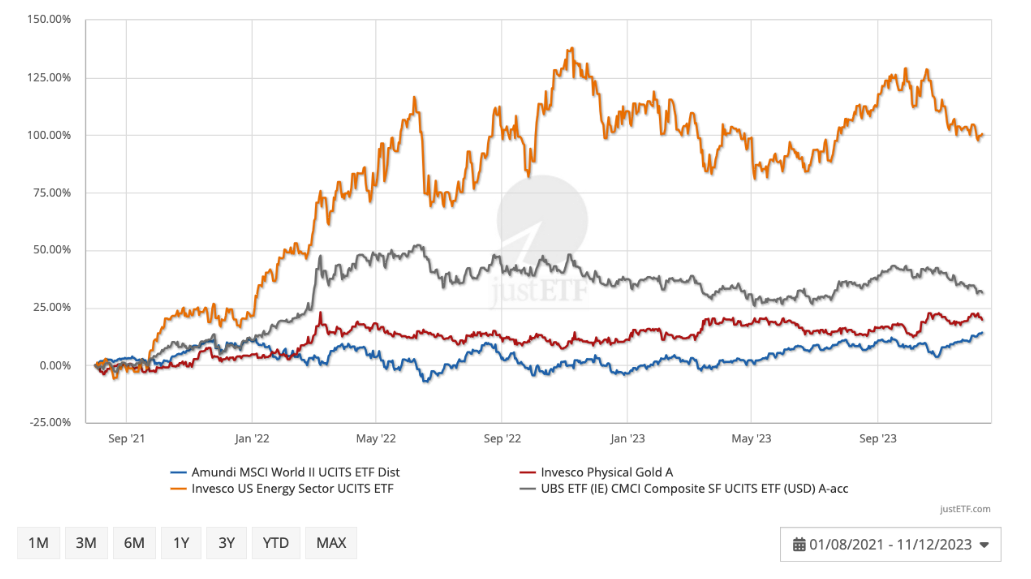
Gold, broad commodities and energy equities fall into the unreliable bucket. Here’s how ETFs representing each asset class have performed sinceinflation took off. We’ve included an MSCI World ETF as a comparison.MSCI vs asset classes: high inflation 2021-23
Amundi MSCI World UCITS ETF Dist
Invesco Physical Gold A
Invesco US Energy Sector UCITS ETF
UBS ETF (IE) CMCI Composite SF UCITS ETF (USD) A-acc
Invesco Physical Gold A
Invesco US Energy Sector UCITS ETF
UBS ETF (IE) CMCI Composite SF UCITS ETF (USD) A-acc
Source: justETF Research
Our three inflation-hedges don’t look unreliable in these conditions versus World equities. Indeed, they’ve all beatenEuropean Union inflation:
- Energy equities (orange line): 100.5%
- Broad commodities (grey line): 31.6%
- Gold (red line): 19.8%
- MSCI World (blue line): 14.2%
- Gold in particular has been shown to have a weak historic correlation with unexpected inflation. Its reputation as an inflation hedge is largely driven by its stratospheric return 1979.
- Meanwhile, the energy sector has only worked fitfully against past inflation spikes. Notably it posted a loss during the infamous 1972-74 oil crisis.
- Broad commodities are similarly fickle – sometimes posting spectacular gains during an inflationary period but not always. In particular, commodities can act as a leading indicator by surging ahead of looming inflation as raw material prices spike. But then commodity funds fall away again as price pressures start to ease at the factory gates (though consumers may still be feeling the pinch in the shops).
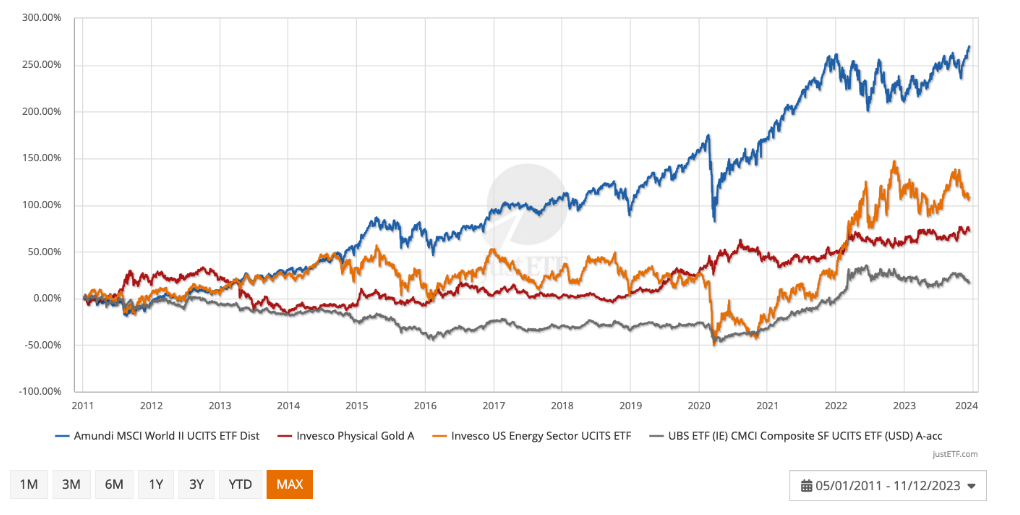
MSCI vs asset classes: Max. performance
Amundi MSCI World UCITS ETF Dist
Invesco Physical Gold A
Invesco US Energy Sector UCITS ETF
UBS ETF (IE) CMCI Composite SF UCITS ETF (USD) A-acc
Invesco Physical Gold A
Invesco US Energy Sector UCITS ETF
UBS ETF (IE) CMCI Composite SF UCITS ETF (USD) A-acc
Source: justETF Research
Here’s the cumulative return for each asset class over the longest time frame available using relevant ETFs (since 5 Jan 2011):
- Energy equities (orange line): 108.5% max return
- Broad commodities (grey line): 17% max return
- Gold (red line): 72.4% max return
- MSCI World (blue line): 270.2% max return
justETF tip: It’s the unreliability and uncertain expected returns of inflation-hedges that makes a simple inflation-beating strategy of investing in an MSCI World ETF a good move.
Inflation-hedge bucket no2: the compromised
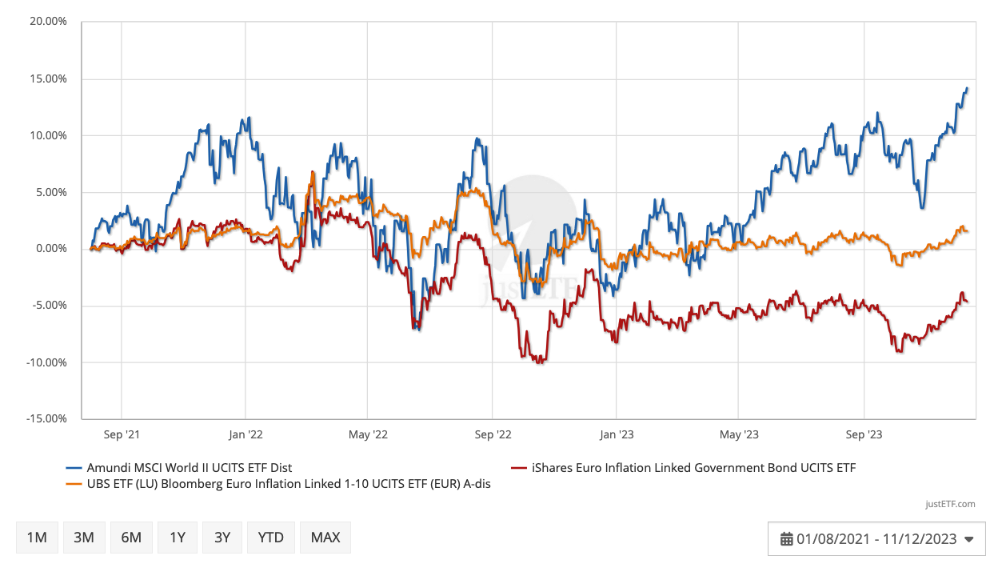
Inflation-linked bonds are the one asset class specifically designed to hedge against inflation. Their interest and principal payouts increase in line with prices to compensate investors against inflationary shocks. For this reason, inflation-linked bonds are widely considered to be a reliable hedge. However, ETFs tracking Euro denominated inflation-linked bonds have not shone at this stage in the cycle:MSCI vs Euro inflation-linked ETFs
Amundi MSCI World UCITS ETF Dist
iShares Euro Inflation Linked Government Bond UCITS ETF
UBS ETF (LU) Bloomberg Euro Inflation Linked 1-10 UCITS ETF (EUR) A-dis
iShares Euro Inflation Linked Government Bond UCITS ETF
UBS ETF (LU) Bloomberg Euro Inflation Linked 1-10 UCITS ETF (EUR) A-dis
Source: justETF Research
This is what the return looks like over the recent inflationary period:
- Shorter term Euro inflation-linked government bonds (orange line): 1.6%
- Medium term Euro inflation-linked government bonds (red line): -4.6%
- MSCI World (blue line): 14.2%
- Real yield is the return bond investor’s demand on top of their inflation protection
- When bond yields rise the prices of existing bonds fall to compensate
- This effect caused bonds to decline across the board when interest rates rocketed in 2022
justETF tip: Short bonds are relatively close to their maturity dates, while long bonds are many years (sometimes decades) away from maturing.
- Short dated inflation-linked bonds are a better immediate inflation hedge than longer dated ones
- Bond funds in general have suffered as yields have risen from the historic lows reached in the aftermath of the Global Financial Crisis and the pandemic
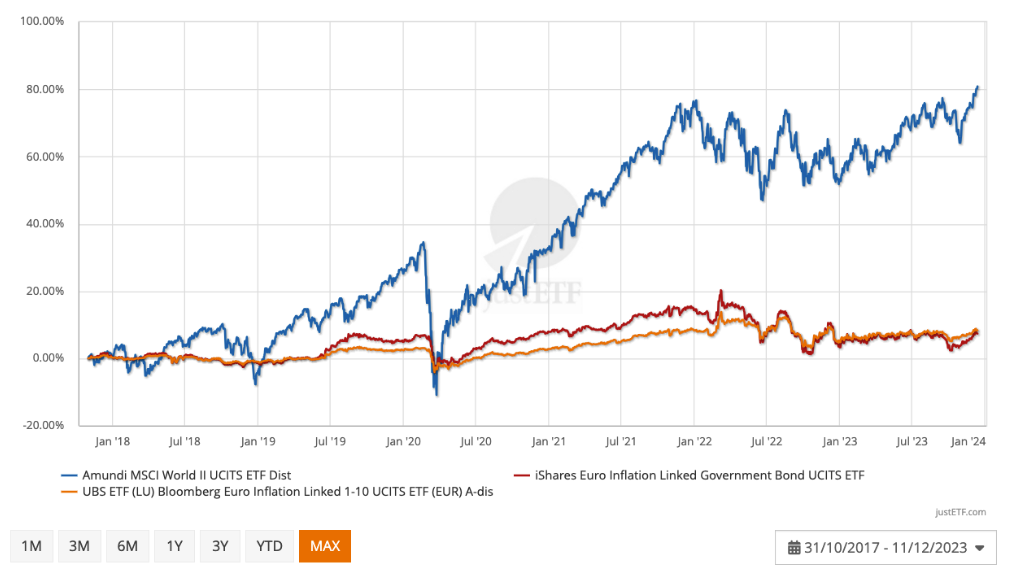
MSCI vs Euro inflation-linked ETFs max.
Amundi MSCI World II UCITS ETF Dist
iShares Euro Inflation Linked Government Bond UCITS ETF
UBS ETF (LU) Bloomberg Euro Inflation Linked 1-10 UCITS ETF (EUR) A-dis
iShares Euro Inflation Linked Government Bond UCITS ETF
UBS ETF (LU) Bloomberg Euro Inflation Linked 1-10 UCITS ETF (EUR) A-dis
Source: justETF Research
- Shorter term Euro inflation-linked government bonds (orange line): 7.2% max return
- Medium term Euro inflation-linked government bonds (red line): 7.4% max return
- MSCI World (blue line): 80.8% max return
Inflation-hedge bucket no3: the myth
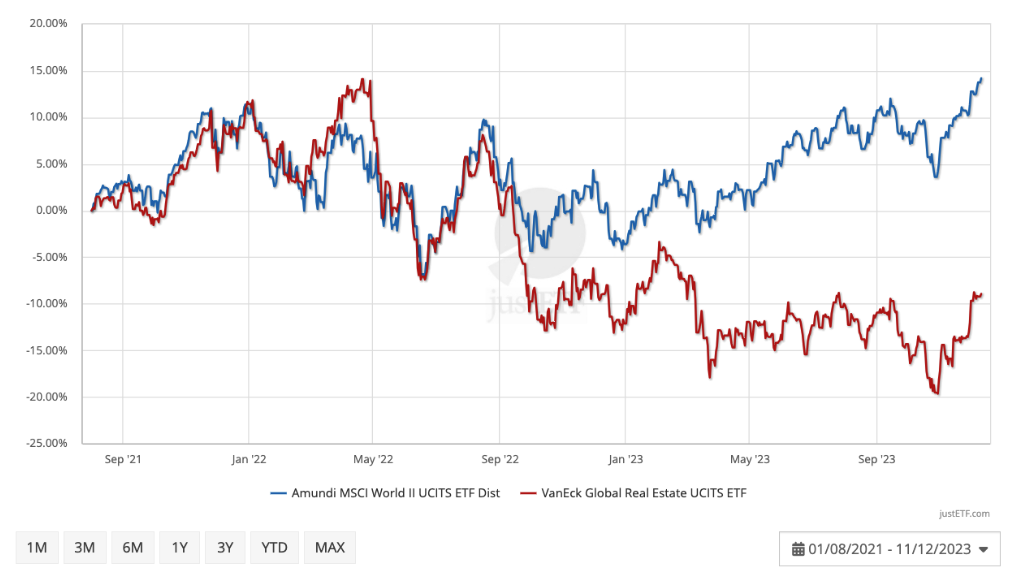
Real estate is said to be useful against inflation. However commercial property is down significantly since inflation took hold, and has underperformed the MSCI World since then:MSCI vs Real Estate
Lyxor MSCI World UCITS ETF - Dist
VanEck Global Real Estate UCITS ETF
VanEck Global Real Estate UCITS ETF
Source: justETF Research
This is how the two asset classes measure up:
- Global real estate (red line): -8.9%
- MSCI World (blue line): 14.2%


