Analyse the performance of your portfolio and its components
On the "Performance" page you can analyse how your portfolio performed in the past and compare it with benchmarks or other portfolios. Performance attribution to indices, asset classes and single ETFs provides further insights. These functions are only available in the Premium version.Go to portfolio performance:
Portfolio Overview > Dashboard > Performance
Portfolio Overview > Dashboard > Performance
Performance chart
Track the development of your portfolio, asset classes or ETFs. You may adjust the chart according to your needs and add benchmarks or portfolios as a comparison.Hint: There are various ways of calculating return. justETF calculates time-weighted returns as they allow for the comparison of different investments. If you want to know more about different ways of calculating return, read our article on Return calculation in the spotlight.
Select time frame

Either select a predefined time frame or tailor it to your needs.
All figures in the charts and table below are automatically updated once the time frame is adjusted.
Use the drop-down options below the performance chart in order to analyse your portfolio on different levels including total portfolio, asset classes, indices and ETFs. You may choose between the relative or absolute change and the market value of your portfolio. Move the mouse over the graph to display individual data points.
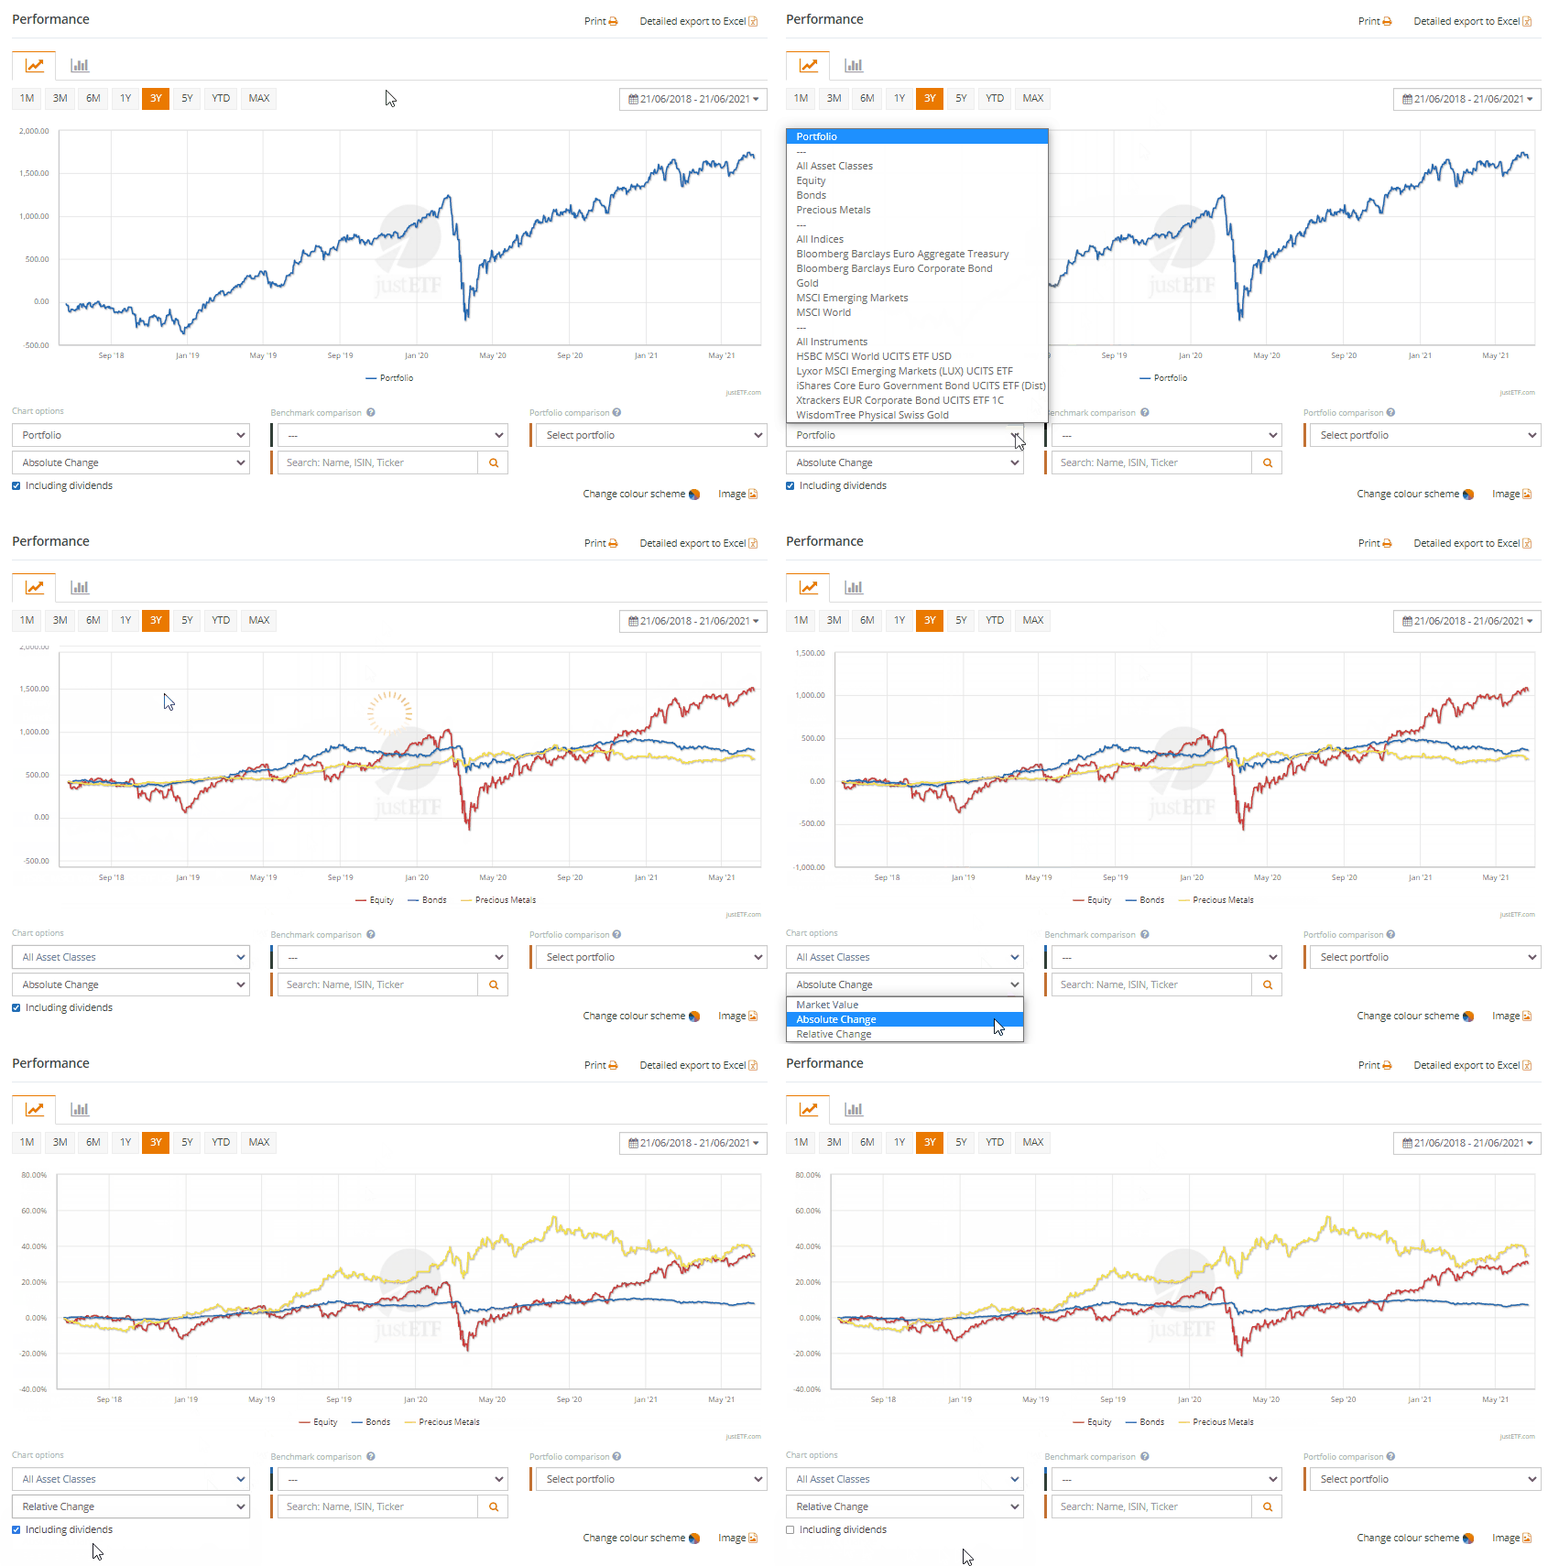
Hint: By clicking on the legend below the chart, you can display or hide single positions in the chart.
Please keep in mind that past performance is no prediction for future performance.
Benchmark comparison
Besides choosing between different interest rates, you may select an ETF of your choice as a benchmark. Select the desired comparison size from the drop-down menu or search for ETFs by typing name, ISIN or ticker into the benchmark input field below the chart.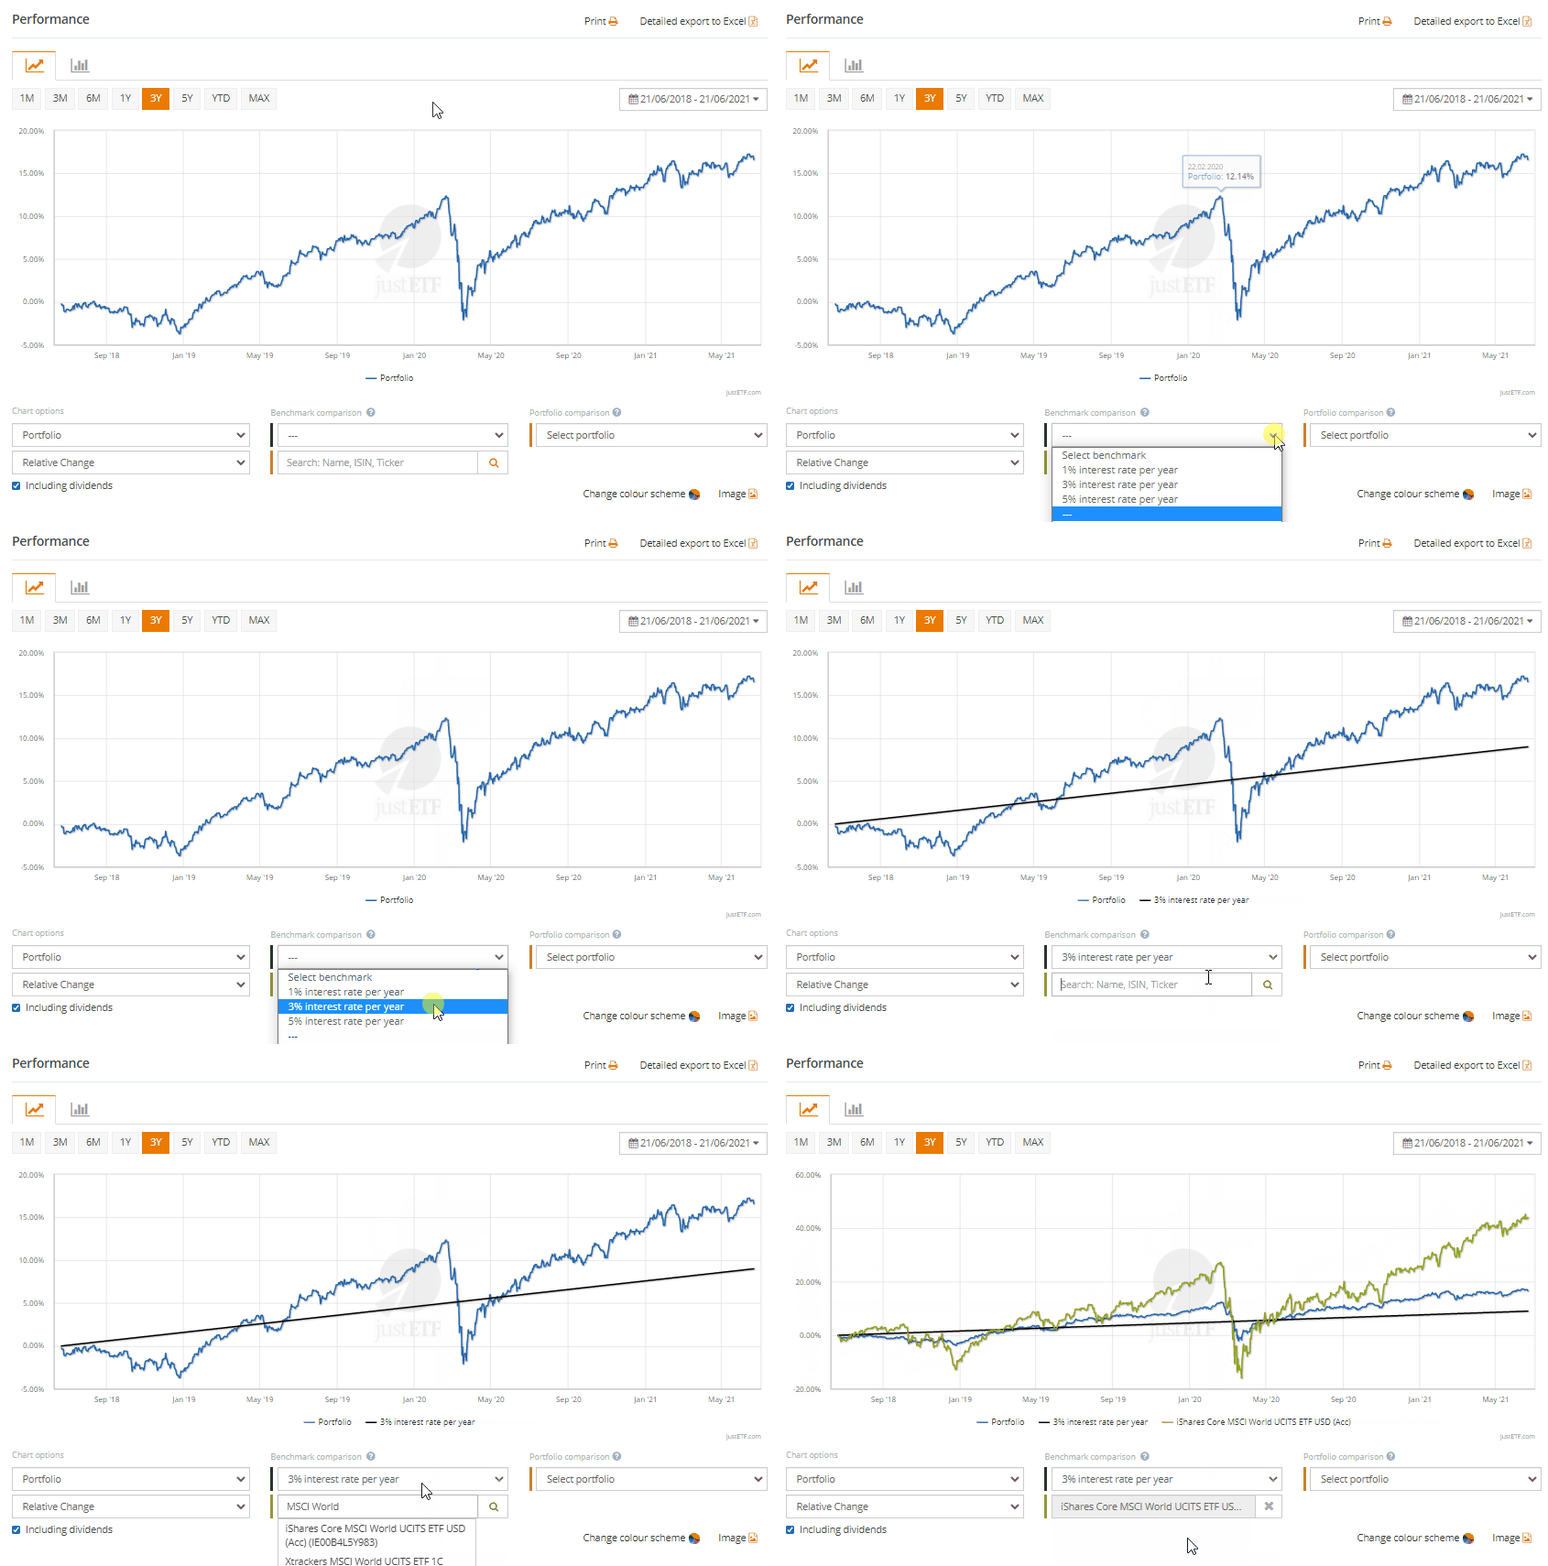
Portfolio comparison
Compare the performance of your portfolios with one another. Click on “select portfolio” and pick the portfolio you want to compare your currently selected portfolio with.Hint: Please keep in mind that you have most likely set up portfolios at different points in time. The simulation starts with the launch date of the latest portfolio. Furthermore, the justETF system makes portfolios of different size comparable by assigning the same investment amount for the simulation.
Performance of asset classes
Keep track of how your asset classes have performed. All ETFs will be aggregated to their corresponding asset classes and their performance will be weighted accordingly.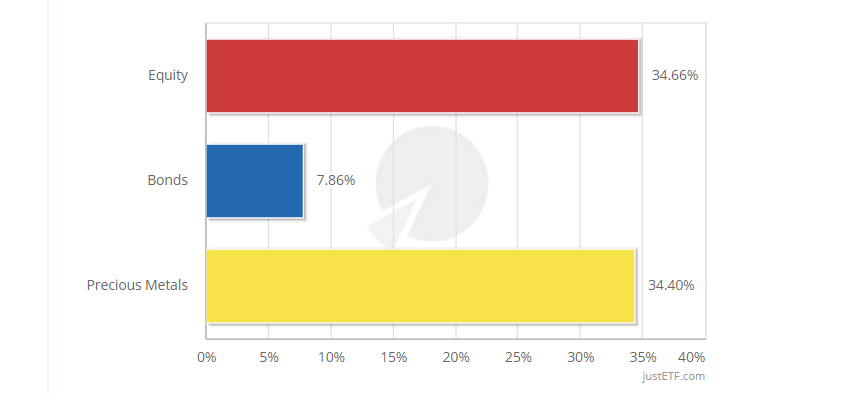
Performance by indices
Break down your portfolio performance to the index level. If there are various ETFs on the same index, their performance will be aggregated.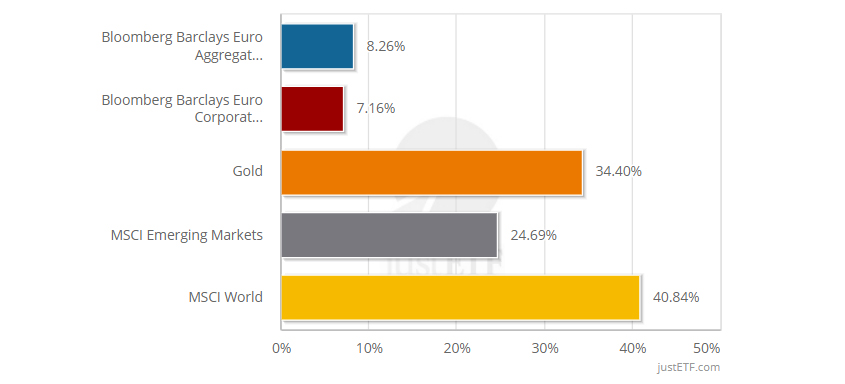
Performance attribution in detail
In addition to asset classes and indices, you are able to compare the performance for every single position in detail.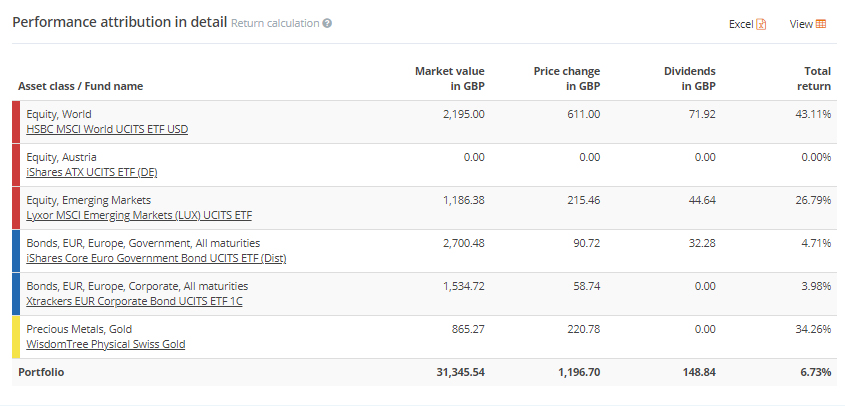
Attention:
When calculating time-weighted returns, it is possible that the total portfolio value falls below the initial investment amount but the return remains positive. This may happen if you deposit money in or withdraw money from your portfolio. An example can be found in our article Return calculation in the spotlight.Export to Excel/image
You may download all charts as images. Click on “image” below the chart you want to export as an image.Additionally, you have the option to export performance data to excel. Click on “Detailed export to Excel” to download the daily performance data to Excel. Click on "Excel" in the detailed view of the value contributions to download the table in Excel format.
Do you want to compare the risk and return of your portfolio? Check out the risk cloud!