Historical simulation of performance and value contributions in portfolio planning
The simulation allows you to historically simulate the performance of your asset allocation in the planning mode. In various charts and a table view, you are able to analyse the performance as if you would have already invested your investment amount in this strategy for example one year ago. This function is only available in the Premium version of justETF.Performance of the total portfolio, asset classes or individual ETFs
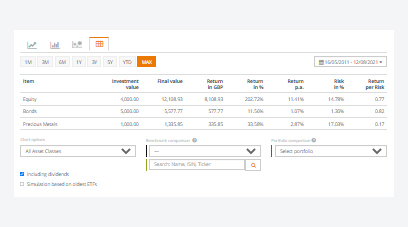
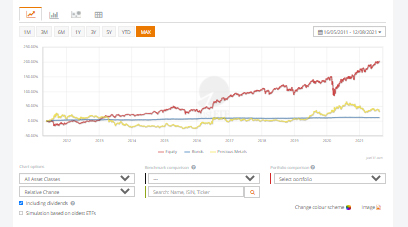
You can find the portfolio simulation under the summary portfolio metrics at the bottom of the Portfolio Planner page. Use the selection options below the chart to analyse the portfolio you have designed at different levels. You can have historical performance simulated at the portfolio, asset class, index, or ETF level. In addition to the percentage performance, you can display the absolute change or the market value in the chart. Move the mouse over the chart to display individual data points.
justETF tip: By clicking on the legend in the chart, positions can be shown or hidden.
Please note ...
Past performance is not a forecast nor a guarantee for future performance.Simulation period is freely selectable
You can choose any individual period for which you like to simulate your ETF strategy. However, the maximum available time period is limited to the youngest ETF in the portfolio, as the performance simulation is based on the past performance of the ETFs. Select the option "Simulation based on the oldest ETFs" to use the maximum possible period for the simulation. Here, the system automatically selects the oldest available ETF on the selected indices.ETF strategy can be adapted at any time during simulation
In the planning mode, you can always adapt your simulated ETF strategy and the simulation results are immediately updated automatically.Benchmark comparison
In addition to different interest rates, you are able to add any ETF as a benchmark for the simulation. Select the desired benchmark in the drop-down menu or simply enter the name, ISIN or WKN of the desired ETF in the search field below the chart.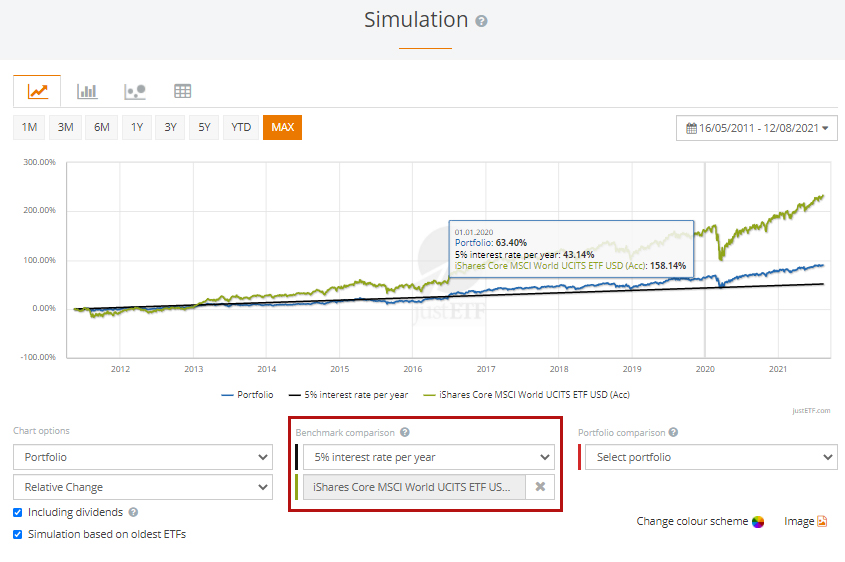
Portfolio comparison
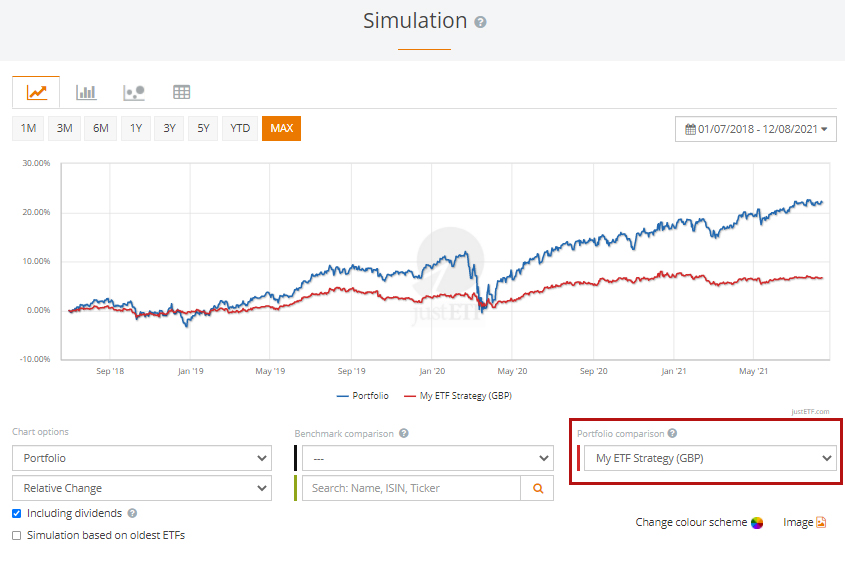
In addition to single ETFs, you are able to add each of your existing portfolios and compare the performance in detail with your new strategy. Simply select the desired portfolio under "Portfolio comparison".Please note that the comparison period is limited to the launch date of your existing portfolio. The justETF system also makes portfolios of different sizes comparable by assuming the same investment amount for both portfolios at the start time of the simulation.
Simulation in charts and table view
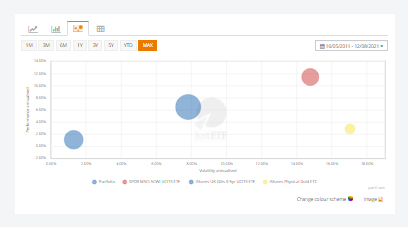
To analyse the simulation results, a line chart, a bar chart, a risk cloud and a table view are available.In the risk cloud, you get the annualised return and the annualised risk of all positions in the portfolio simulated over the selected period. The size of the circles corresponds to the weight of a position in the portfolio. For more information, see our tutorial on the risk cloud.
Line chart
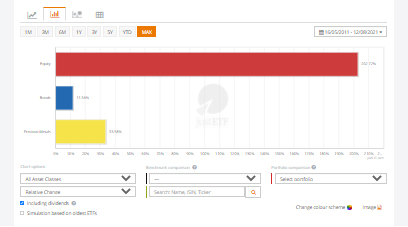
Bar chart
Risk cloud
Table