
- Level: For all
- Reading duration: 3 minutes
What to learn in this article
3 ETF portfolios, 10,000€, and 10 years
Imagine you had 10,000€ squirrelled away in a simple MSCI World portfolio ten years ago. How much would your money have grown? This chart tells the story: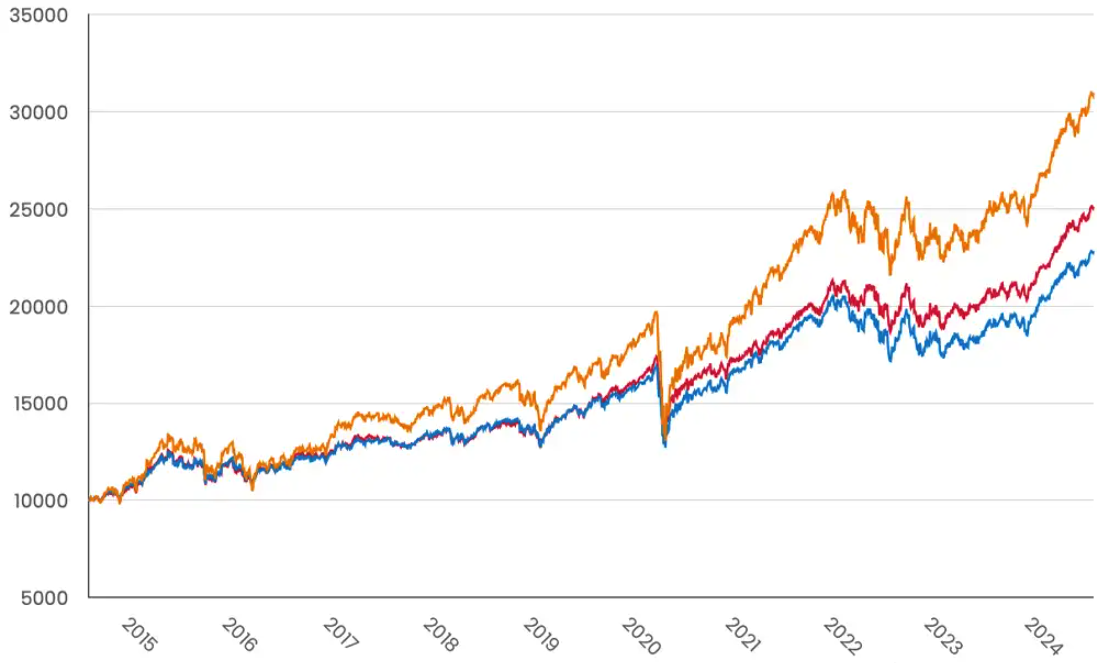
MSCI World 100% MSCI World 60% /40% Bonds MSCI World 60% / 20% Bonds / 20% Gold
Source: justETF research, 26 Jun 2014 - 25 Jun 2024, dividends included
We’ve selected three straightforward ETF portfolios for this comparison - each one using an MSCI World equity ETF as its engine room.
The 100% MSCI World equity ETF portfolio (orange line) has performed staggeringly well over the past ten years:
10,000€ grew more than threefold: transforming into 30,990€ simply by using a buy and hold strategy.
That’s a 210% cumulative growth rate or an astounding 12% annualised.
You had to withstand a sharp dip during the Covid crash of 2020, and choppy waters during 2022 to 2023, but overall, the past ten years has been a fantastic time to hold a diversified global stock index like the MSCI World.
Good to know: The MSCI World 100 portfolio (orange line) = 100% iShares Core MSCI World UCITS ETF USD (Acc), 0.2% fees per year.
Lower returns, lower risk
The problem with going all-in on equities is that they are a risky asset class that can dip into the red for long periods. That’s why it’s a good idea to diversify into other assets. We’ve done exactly that by pairing the iShares Core MSCI World ETF with an iShares Euro Government Bond ETF (blue line) – using a classic 60 / 40 asset allocation. That should make your portfolio less susceptible to stock market crashes but is also likely to lower its overall return – and that’s exactly what we see in the chart above. 10,000€ more than doubled – becoming 22,831€ in ten years. That’s a 128% cumulative growth rate or 8.6% annualised. Volatility (a measure of risk) was also lower, weighing in at 11% versus 16% for the 100% MSCI World portfolio. In other words, this portfolio was less of a wild ride than its full-on equity counterpart.Good to know: The MSCI World 60 / 40 portfolio (blue line) = 60% iShares Core MSCI World UCITS ETF USD (Acc), 40% iShares Euro Government Bond 7-10yr UCITS ETF EUR (Dist), 0.18% fees per year.
Golden child
Our final portfolio added gold into the mix. Gold is a great diversifier as it often performs when equities and bonds falter. That’s why the 60 / 20 / 20 (red line) portfolio pulls away from the 60 / 40 portfolio after Covid hits. Gold performed well versus bonds during that period of high inflation and uncertainty. Thus our gold-plated portfolio has the edge over the 60 / 40 – turning 10,000€ into 25,123€. That’s an impressive 151% cumulative growth rate or 9.6% annualised.Good to know: The MSCI World 60 / 20 / 20 portfolio (red line) = 60% iShares Core MSCI World UCITS ETF USD (Acc), 20% iShares Euro Government Bond 7-10yr UCITS ETF EUR (Dist), 20% iShares Physical Gold ETC, 0.17% fees per year.


