
What you can expect in this article
Introduction
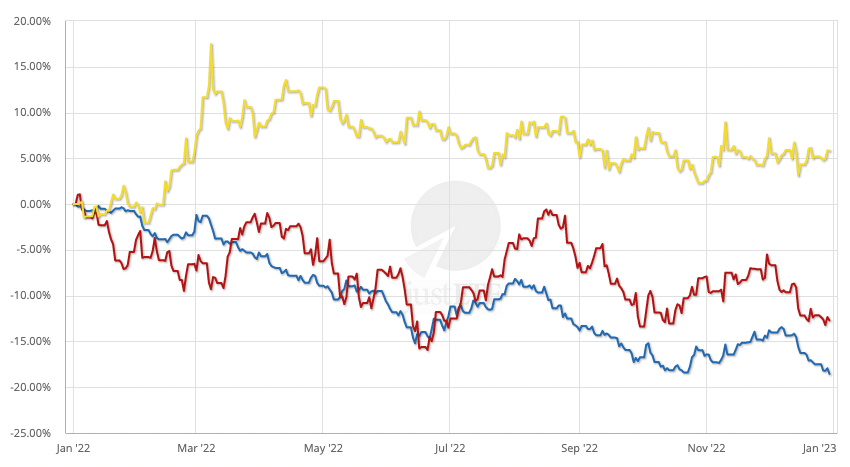
The main reason to own gold in your portfolio is that it can work when the other major asset classes fail. Take the current slump – triggered by an energy crisis and compounded by war, surging inflation, and rising interest rates. Both equities and government bonds have tumbled together (which historically happens about a third of the time during major market downturns). Yet gold has stayed in positive territory throughout as you can see in this chart:Performance of various asset classes from 01.01.2022 - 31.12.2022 (in EUR)
MSCI World Euro government bonds Gold
Source: justETF Research, 18.01.2023
The chart illustrates the potential of gold to add an extra level of diversification beyond equities and bonds.
- Gold (the yellow line) was up 9% when World equities (red line) were at their lowest ebb – slipping to -15,9% in June 2022.
- And when Euro government bonds (blue line) fell to -18.5% on New Year's Eve 2022, gold provided some cheer with a 5.8% return.
The inflationary 1970s
The 1970s were years of economic strife, rampaging inflation, and eye-watering interest rates. Equities and bonds both suffered back then, but gold bucked the trend:Performance of MSCI World vs. Gold during the 1970s (in EUR)

MSCI World Gold
Source: justETF Research, 18.01.2023
While world equities slipped underwater for eight years (and bonds dropped too), gold thrived in the conditions of social and economic turmoil that marked the era. And this gives us a clue as to why gold belongs in a fully diversified portfolio.
Investors often turn to gold during times of great fear and uncertainty about the future. The yellow metal’s role as a long-term store of value reassures people that it’s a sound repository for their wealth – irrespective of the fate of conventional assets such as equities, bonds, and cash.
Does that mean gold is a good inflation hedge?
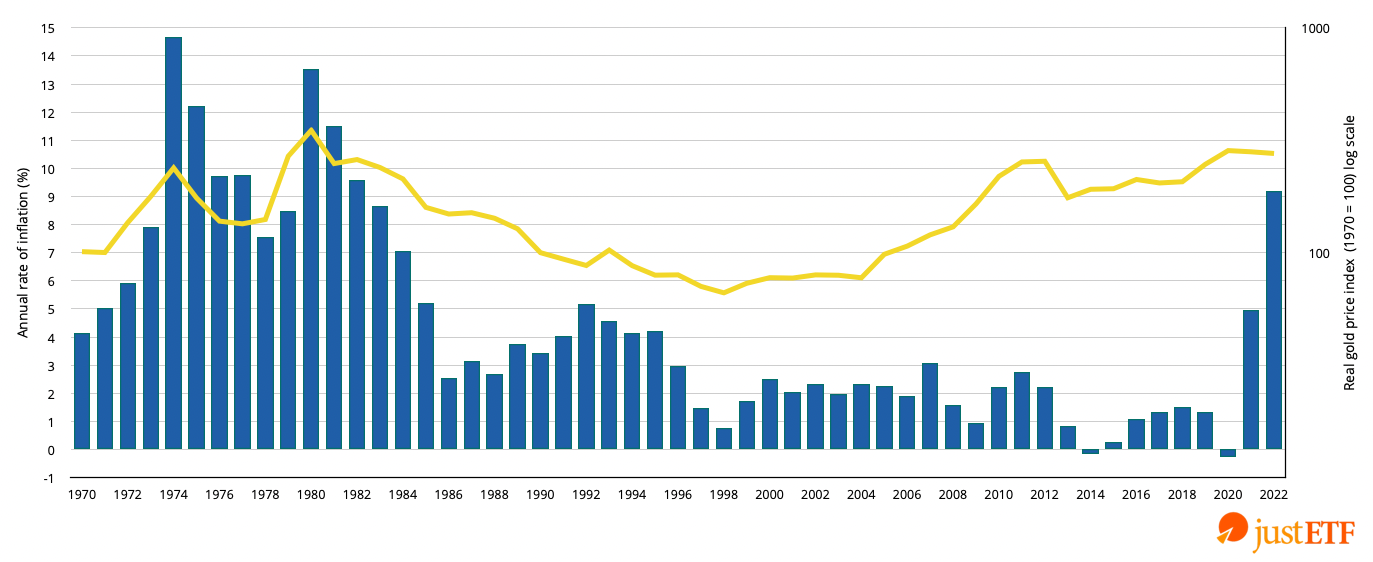
If the question is “will gold always beat inflation,” then the answer is “no.” If the question is “has gold historically coped with extreme inflation better than other asset classes,” then the answer is a qualified “yes.” This graphic shows that gold dealt admirably with the two bouts of high, unexpected inflation that bookend the half century from 1970 to 2022:Gold price vs. Euro area inflation (1970 - 2022)
Annual inflation Gold
Source: justETF Research, 18.01.2023
See how the gold price rose in real terms during the 1970s and, again, as inflation took off in 2021-22. But the gold price dropped from 1980 to 1999 – regardless of inflation’s path during those years. You can also see that the gold price does not reliably track inflation’s fluctuations across the second half of the graph. If gold was a true inflation hedge then the yellow line would be much flatter. Instead its price has ranged widely without paying much heed to inflation’s rise and fall.
Before 1971, gold’s price was often artificially constrained. Gold was controlled by its peg to the US dollar (1944 - 1971) or by the gold standard system (which collapsed in the 1930s). Thus we can’t put much weight on gold’s data points before the 1970s. And in the contemporary era there have only been two periods when inflation escaped its leash – as discussed above. So while gold’s record against inflation is good during both those episodes, we cannot draw definitive conclusions from only two events. However, there is another reason to diversify into gold.
Gold as a diversifier against stock market crashes
Gold’s ability to rise when World equities fall is even more impressive than government bonds in the 21st Century. Let’s quickly run through the charts that show how good gold was during every bear market and correction dating back to the bursting of the dotcom bubble.justETF note
We’ll compare a gold ETC (yellow line) versus a MSCI World ETF (red line) and a European government bond ETF (blue line) during the critical months of each downturn. In each case, we want to see whether gold stayed in positive territory as equities hit rock bottom.
We’ll compare a gold ETC (yellow line) versus a MSCI World ETF (red line) and a European government bond ETF (blue line) during the critical months of each downturn. In each case, we want to see whether gold stayed in positive territory as equities hit rock bottom.
Example no. 1: The COVID Crash
Performance of asset classes from 24.02.2020 - 24.04.2020 (in EUR)

MSCI World Euro government bonds Gold
Source: justETF Research, 18.01.2023
Gold underperformed bonds but beat equities during the first month of the coronavirus crisis. However, the yellow line shows gold recovered fastest as the markets turned the corner in April.
Gold diversification rating
Beat equities: Beat government bonds:Example no. 2: 2018 Global Stock Market Downturn
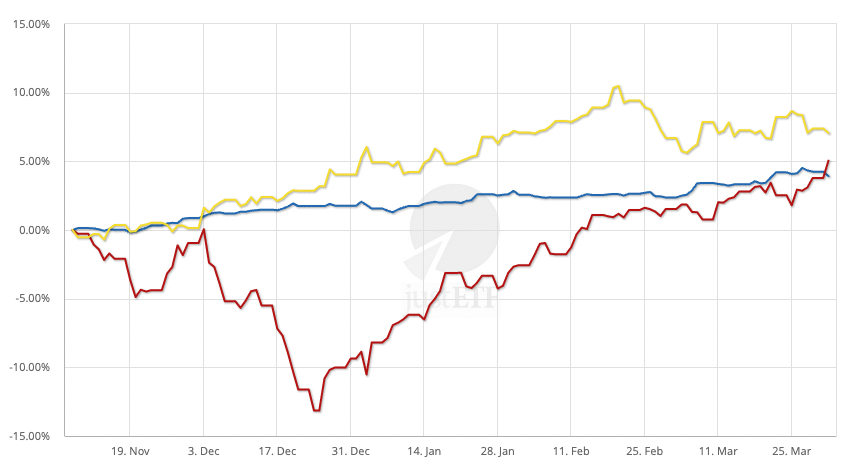
Performance of asset classes from 08.11.2018 - 01.04.2019 (in EUR)
MSCI World Euro government bonds Gold
Source: justETF Research, 18.01.2023
Equities dipped 13.2% on Christmas Eve 2018 while gold nudged ahead of bonds (2.9% vs 1.7%) on the defensive side.
Gold diversification rating
Beat equities: Beat government bonds:Example no. 3: August 2011 Stock Market Downturn
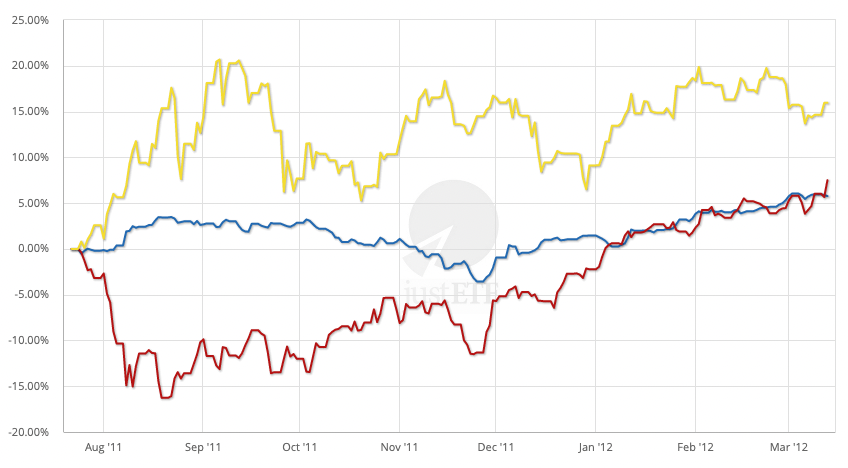
Performance of asset classes from 22.07.2011 - 13.03.2012 (in EUR)
MSCI World Euro government bonds Gold
Source: justETF Research, 18.01.2023
World equities plunged 16.3% in August 2011 on fears of a double dip recession. But gold pulled heroically in the opposite direction (up 15.4%), way ahead of bonds (up 3.4%).
Gold diversification rating
Beat equities: Beat government bonds:Example no. 4: European Sovereign Debt Crisis
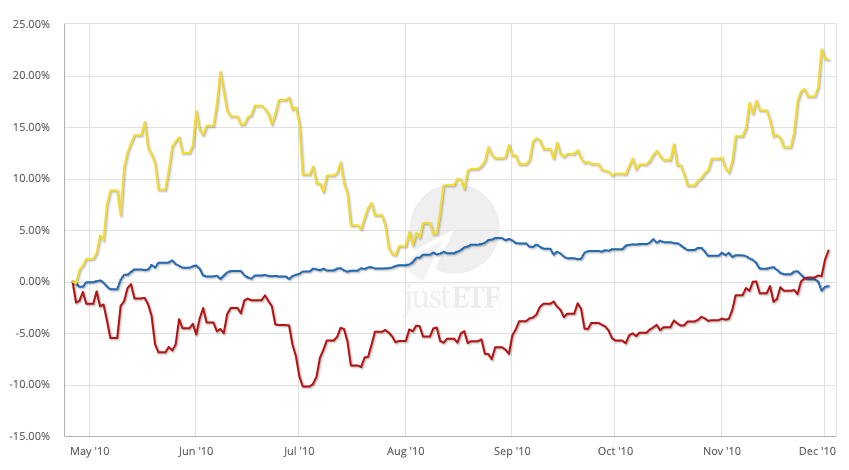
Performance of asset classes from 26.04.2010 - 02.12.2010 (in EUR)
MSCI World Euro government bonds Gold
Source: justETF Research, 18.01.2023
- The aftershocks from the Global Financial Crisis continued to shake the world. As equities sagged 10% in July 2010, government bonds only managed 1%, but gold was the place to be.
- The precious metal spiked over 20% in June and was still more than 20% ahead of equities when the market bottomed in July.
Gold diversification rating
Beat equities: Beat government bonds:Example no. 5: Global Financial Crisis (GFC)
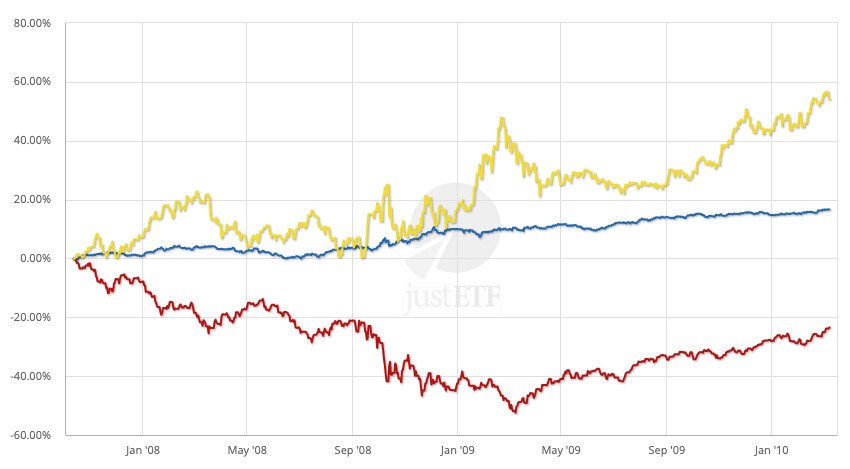
Performance of asset classes from 12.10.2007 - 09.03.2010 (in EUR)
MSCI World Euro government bonds Gold
Source: justETF Research, 18.01.2023
- The greatest threat to the financial system since the Great Depression saw equities crash 52.4% in March 2009.
- But Gold had its finest hour since the 1970s – registering a 38.3% gain on the darkest day for the market.
- Bonds performed their defensive duties too: up 10.4% on 9 March.
Gold diversification rating
Beat equities: Beat government bonds:Example no. 6: Dotcom bust
Performance of asset classes from 2000 - 2005 (in EUR)

MSCI World Gold
Source: justETF Research, 18.01.2023
There were few ETFs available back in 2000 so we turn once again to MSCI World index and gold price data for a comparison. The dotcom bubble burst with a furious bang that led to a -54% collapse in world equities by March 2003. Gold was small consolation at the time but at least it was up 3.8%.
Gold does not always work
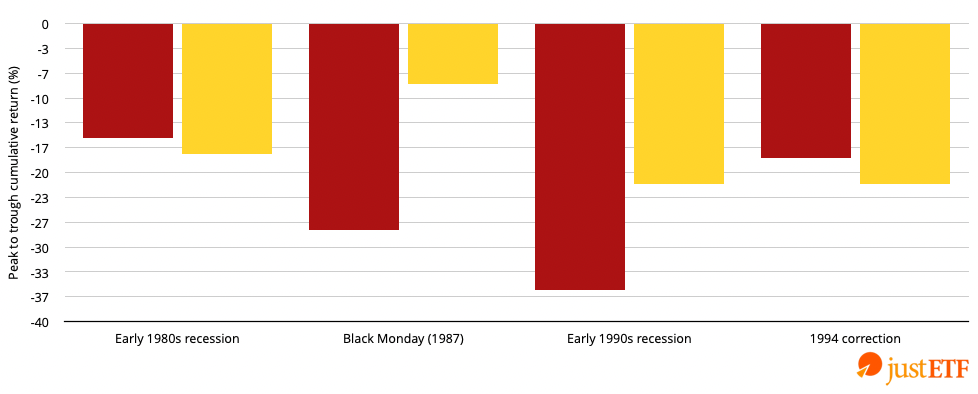
When gold fails (1980s - 1990s)
MSCI World (EUR) Gold (EUR)
Source: justETF Research, 18.01.2023
The case for gold looks utterly compelling until you dial up its returns from the 1980s and 1990s. The chart above shows the low point of every serious market drawdown during those decades. Gold fell into negative territory on all four occasions. It performed even worse than equities at the bottom of the early 1980s recession and the 1994 correction, too. So gold does not always work in a crisis, even though it has had a superb 21st Century so far.


