Can we really have the best of both worlds?
Smart Beta ETFs seek to exploit investing anomalies that are known to have beaten the market over the long term.For example, the set of undervalued companies, highly profitable companies, small companies and companies whose share prices have risen over the last 12-months have long track records of outperformance. This group of Smart Beta ETFs is also called Factor ETF and is the main focus of this article. Other indices, whose construction principles differ from those of traditional indices, also include dividend, moat, sustainability and megatrend indices as well as Islamic index families.
The secret is to create a factor index that filters out the companies that don’t fit the Smart Beta profile and concentrate on those that do.
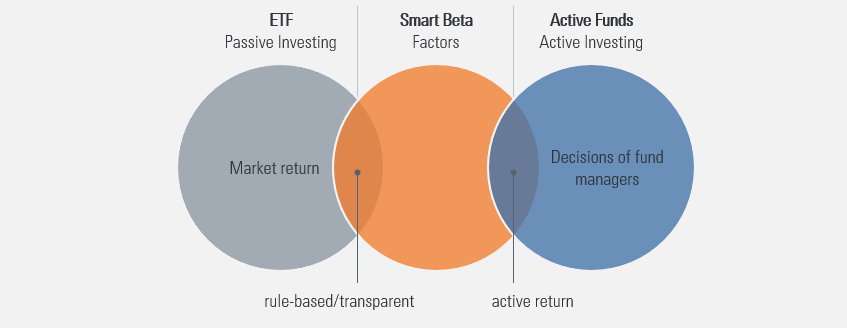
Smart beta ETFs in comparison with classic ETFs and active funds

Source: justETF Research
To understand this more, let’s consider how a purely passive ETF works. It will generally follow a market cap index, for example, the FTSE All-Share or the S&P 500.
Securities in these indices are tracked in direct proportion to their market value. In other words, if Apple is worth 5% of the market value of all the companies in the index then it will be given a 5% share of the index.
An ETF that replicates that index will then generally hold 5% of its assets in Apple.
It’s by holding the same securities as the market (as measured by the index), and in the same proportions, that a passive ETF seeks to deliver the returns of the market.
That’s a comparatively simple process because the index automatically makes the fund manager’s investing decisions – which is why ETFs can charge extremely low fees.
Smart beta indices are constructed differently. The design is based on other, additional data on the securities represented in the index. These data, which are sometimes difficult to obtain, are used twice: for the selection of the securities on the one hand and for the weighting of the selected securities in the index on the other. Depending on the index provider and ETF provider, the focus is either on the stock selection or stock weighting. The methods are not always easy to understand. For example, the major index provider MSCI uses the well-known indices such as the MSCI World as the starting index for its factor indices. The stock selection is also comprehensible to the extent that factors researched by MSCI are used. However, the final weighting is generated using mathematical optimisation to ensure the smallest possible deviations from the properties of the source index.
Other index providers select the securities of an initial index according to the respective factor criteria and then weigh all securities in the new index equally. Depending on the index provider, the finished factor indices are either very broadly diversified or very narrow. If the selection process already starts with a limited universe such as European dividend stocks and is narrowed again by the stock selection, diversification suffers and the turnover in the portfolio increases. This results in increased trading costs, which can jeopardise the performance of the investment approach. Volatility may also increase.
The ETF provider WisdomTree, for example, puts great emphasis on broad diversification despite the use of Smart Beta information and often still includes information on dividends in its index construction. This ultimately means that you need to take a close look at the index families and their construction in order to be able to use Smart Beta ETFs productively in your own portfolio. Furthermore, it is necessary to define your own objective before investing: Do you want to use Smart Beta ETFs to achieve an excess return compared to classic indices or do you rather want to dampen market fluctuations?
This is possible because Smart Beta ETFs not only react differently to the market but also cost more. The additional costs are caused by two reasons: On the one side, the expense is higher than with classic indices. On the other side, there is less ETF selection and therefore less competition than with classic ETFs. Nevertheless, they are still much cheaper than active investment funds.
Why should this work?
Because world-leading financial academics and analysts have delved deep into the data to uncover which types of securities have provided the greatest return over the lifetime of the markets.In the same way that equities beat cash and bonds over time because investors expect to be rewarded for investing in riskier assets, the academics have discovered securities which outperform their peers because they are riskier or because they somehow confound human behaviour, causing them to be undervalued.
The academics have also developed formulas which help identify these special security categories which are known as investing styles or factors. It’s these factors and formulas which underpin Smart Beta ETFs.
There are many different factors out there but the five most successful and reliable are:
Value – value companies are sluggish, unglamorous firms that are often saddled with debt, volatile dividends and a high degree of earnings risk. Their position looks weak and they tend to be heavily punished during recessions. Investors are known to underrate these stocks in comparison to sexy, high-growth firms like tech start-ups, which explains why a value firm’s comparative cheapness can be a source of strong future returns.
Small-cap – smaller companies are riskier than large-cap ones because they’re more vulnerable to misfortune. For example, bad management, the loss of key staff, a regulatory change or the predations of bigger rivals can all ruin the outlook for a small firm. Hence investors expect a greater investment return in exchange for taking on greater risk.
Quality – companies that are making the most efficient use of their capital tend to outperform less efficient rivals over time. For example, a company that is investing heavily in R&D is more likely to produce innovative products that will enable it to make hay in the years ahead. However, investors often underrate quality firms because their spending makes them look like they’re underperforming now in comparison to cost-cutting rivals.
Momentum – rising stocks will tend to keep rising for a limited period (12-months or less) while losing stocks will continue to fall. This appears to be because investors tend to over-react and under-react to the news. For example, pushing the prices of a darling company to new heights on scant evidence while stubbornly clinging on to a loser even in the face of more bad news.
Low volatility – low volatility stocks have historically delivered market-like returns but for significantly less risk. Low vol companies tend to be large, non-cyclical outfits that are resilient during recessions. For example, we need utility companies to keep powering our homes no matter what, so their profits aren’t badly hit even during tough times. However, profits are unlikely to soar during boom times either as people don’t tend to keep the heating on all day just because they can.
Although all five of the factors above have significantly outperformed the market historically, there is no guarantee they will continue to do so in the future. Moreover, factors can fall out of favour and lag the market for many years. Similarly, market anomalies can be levelled out and disappear due to increased investor interest in factor strategies. By taking on these risks, investors expect to be rewarded with greater returns when economic conditions and sentiment cause individual factors to bounce back.
Historically, the factors „Value“, „Momentum“ and „Small Cap“ have been pro-cyclical. They did especially well in times of economic growth and rising inflation and interest rates. On the other hand, „Quality“ and „Low Volatility“ have been defensive and delivered outperformance in downturns.
New investors should, therefore, understand that the Smart Beta promise of market-beating returns will not necessarily come true and you may have to endure years of underperformance before your investment pays off. In any case, a good performance in the past is a poor indicator for the success of a factor strategy in the future.
However, the main factors listed above have been shown to work across multiple countries, asset classes and decades which is why Smart Beta has become so popular.
Better still, some of the factors have low correlations with one another, so the underperformance of one can often be offset by the outperformance of another. For example, value is known to have low and even negative correlations with profitability and momentum.
Smart Beta Factors in Comparison
| Factor | Historic Risk |
Historic Correlation |
Historic Business Cycle |
|---|---|---|---|
| Value | Equal to normal market risk | Low with Momentum and Quality | Pro-cyclical |
| Small-Cap | Higher than normal market risk | Low with Low Volatility and Quality | Pro-cyclical |
| Momentum | Equal to normal market risk | Low with Value and Quality | Pro-cyclical |
| Quality | Lower than normal market risk | Low with Value, Small Cap and Momentum | Defensive |
| Low Volatility | Lower than normal market risk | Low with Value and Momentum | Defensive |
Source: MSCI.com Research Paper; Foundations of Factor Investing
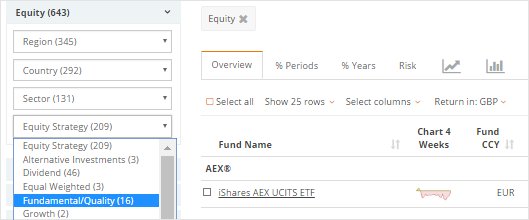
You can find Smart Beta ETFs by using the Equity Strategy drop-down menu of our ETF screener.
The following strategies all count as Smart Beta:


